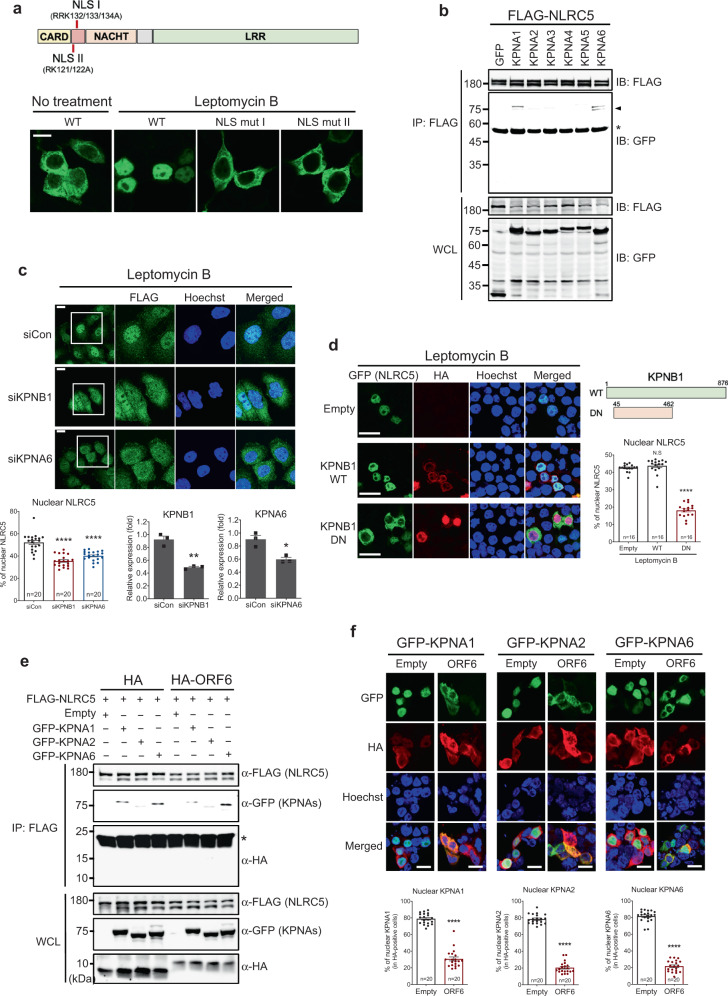
Fig. 6. NLRC5 utilization of the karyopherin complex for nuclear import is targeted by SARS-CoV-2 ORF6.
a The cellular localization of WT or mutant NLRC5 by immunofluorescence analysis. The schematic image of the domain of NLRC5 protein illustrates the positions of two NLSs and the mutated sites at NLSs marked with the red bars. HEK293T cells were transfected with plasmids expressing GFP-tagged WT, NLS I mutant, or NLS II mutant NLRC5. At 24 h after transfection, cells were stimulated with 100 nM of leptomycin B for 8 h and then analyzed by confocal microscopy. The scale bar indicates 20 microns. The results shown are the representative data from the multiple images taken (2–4 images, n = 2 biological replicates) for each experiment. b Immunoblot analysis of the indicated proteins from the immunoprecipitation analysis using FLAG-tagged NLRC5 and GFP-tagged karyopherin alpha subunits. HEK293T cells were transfected with plasmids expressing FLAG-NLRC5, along with GFP alone or GFP-tagged KPNA subunits as indicated. After 48 h incubation, cell lysates were prepared and mixed with anti-FLAG M2 beads. Immunoprecipitated protein complexes were analyzed by SDS-PAGE. Karyopherin bands with smaller sizes are shown with an arrow. The asterisk indicates a heavy chain of the immunoglobulin used for IP. Two percent of the input proteins are shown in the whole cell lysate (WCL) panel. The data shown is the representative result from two independent experiments. c Immunofluorescence analysis of FLAG-tagged NLRC5 cellular localization in KPNB1 or KPNA6 depleted FLAG-NLRC5 stable HeLa cells by leptomycin B treatment (100 nM, 8 h). Quantitative comparison of the nuclear FLAG-NLRC5 signal intensity (% of nuclear signal intensity/whole-cell signal intensity) is shown with a bar graph analyzed by ImageJ (bottom left). The knockdown efficiency of the indicated genes targeted by the specific siRNAs was shown by comparing with gene expression level in the control siRNA transfected cells (bottom middle and right). The results are from three independent experiments. Images were obtained using a confocal microscope. The scale bar indicates 20 microns. The sample numbers for evaluation are indicated in the bar graph. d Immunofluorescence analysis of GFP-tagged NLRC5 cellular localization by WT or dominant-negative KPNB1. HEK293T cells were transfected with plasmids expressing GFP-tagged NLRC5, along with plasmids expressing HA-tagged WT, or dominant-negative (DN) KPNB1. At 24 h after transfection, cells were treated with 100 nM of leptomycin B for 8 h and then analyzed by confocal microscopy. The schematic image depicts the domain of WT or DN KPNB1 with amino acid numbers. Quantitative comparison of the nuclear NLRC5 signal intensity (% of nuclear signal intensity/total cell signal intensity) is shown with a bar graph analyzed by ImageJ. The sample numbers for evaluation are indicated in the bar graph. e Immunoblot analysis of the proteins from the immunoprecipitation analysis using FLAG-tagged NLRC5, HA-tagged empty or SARS-CoV-2 ORF6, and GFP-tagged karyopherin alpha subunits as indicated. HEK293T cells were transfected with plasmids expressing FLAG-NLRC5, along with HA alone or HA-tagged SARS-CoV-2 ORF6, and cotransfected with constructs expressing GFP-tagged KPNA subunits as indicated. After 48 h incubation, cell lysates were prepared and mixed with anti-FLAG M2 beads. Immunoprecipitated protein complexes were analyzed by SDS-PAGE. The asterisk indicates a light chain of the immunoglobulin used for IP. Two percent of the input proteins is shown in the WCL panel. The data shown is the representative result from two independent experiments. f Immunofluorescence analysis of the cellular localization of GFP-tagged karyopherin alpha subunits by HA-empty or HA-SARS-CoV-2 ORF6. HEK293T cells were transfected with the plasmids expressing GFP-tagged KPNA1, KPNA2, or KPNA6, along with plasmids expressing HA alone or HA-tagged SARS-CoV-2 ORF6. At 24 h after transfection, cells were analyzed by confocal microscopy. Quantitative comparison of the nuclear signal intensity (% of nuclear signal intensity/total cell signal intensity) of karyopherins is shown with a bar graph analyzed by ImageJ. The scale bar indicates 20 microns. The sample numbers for evaluation are indicated in the bar graph.

