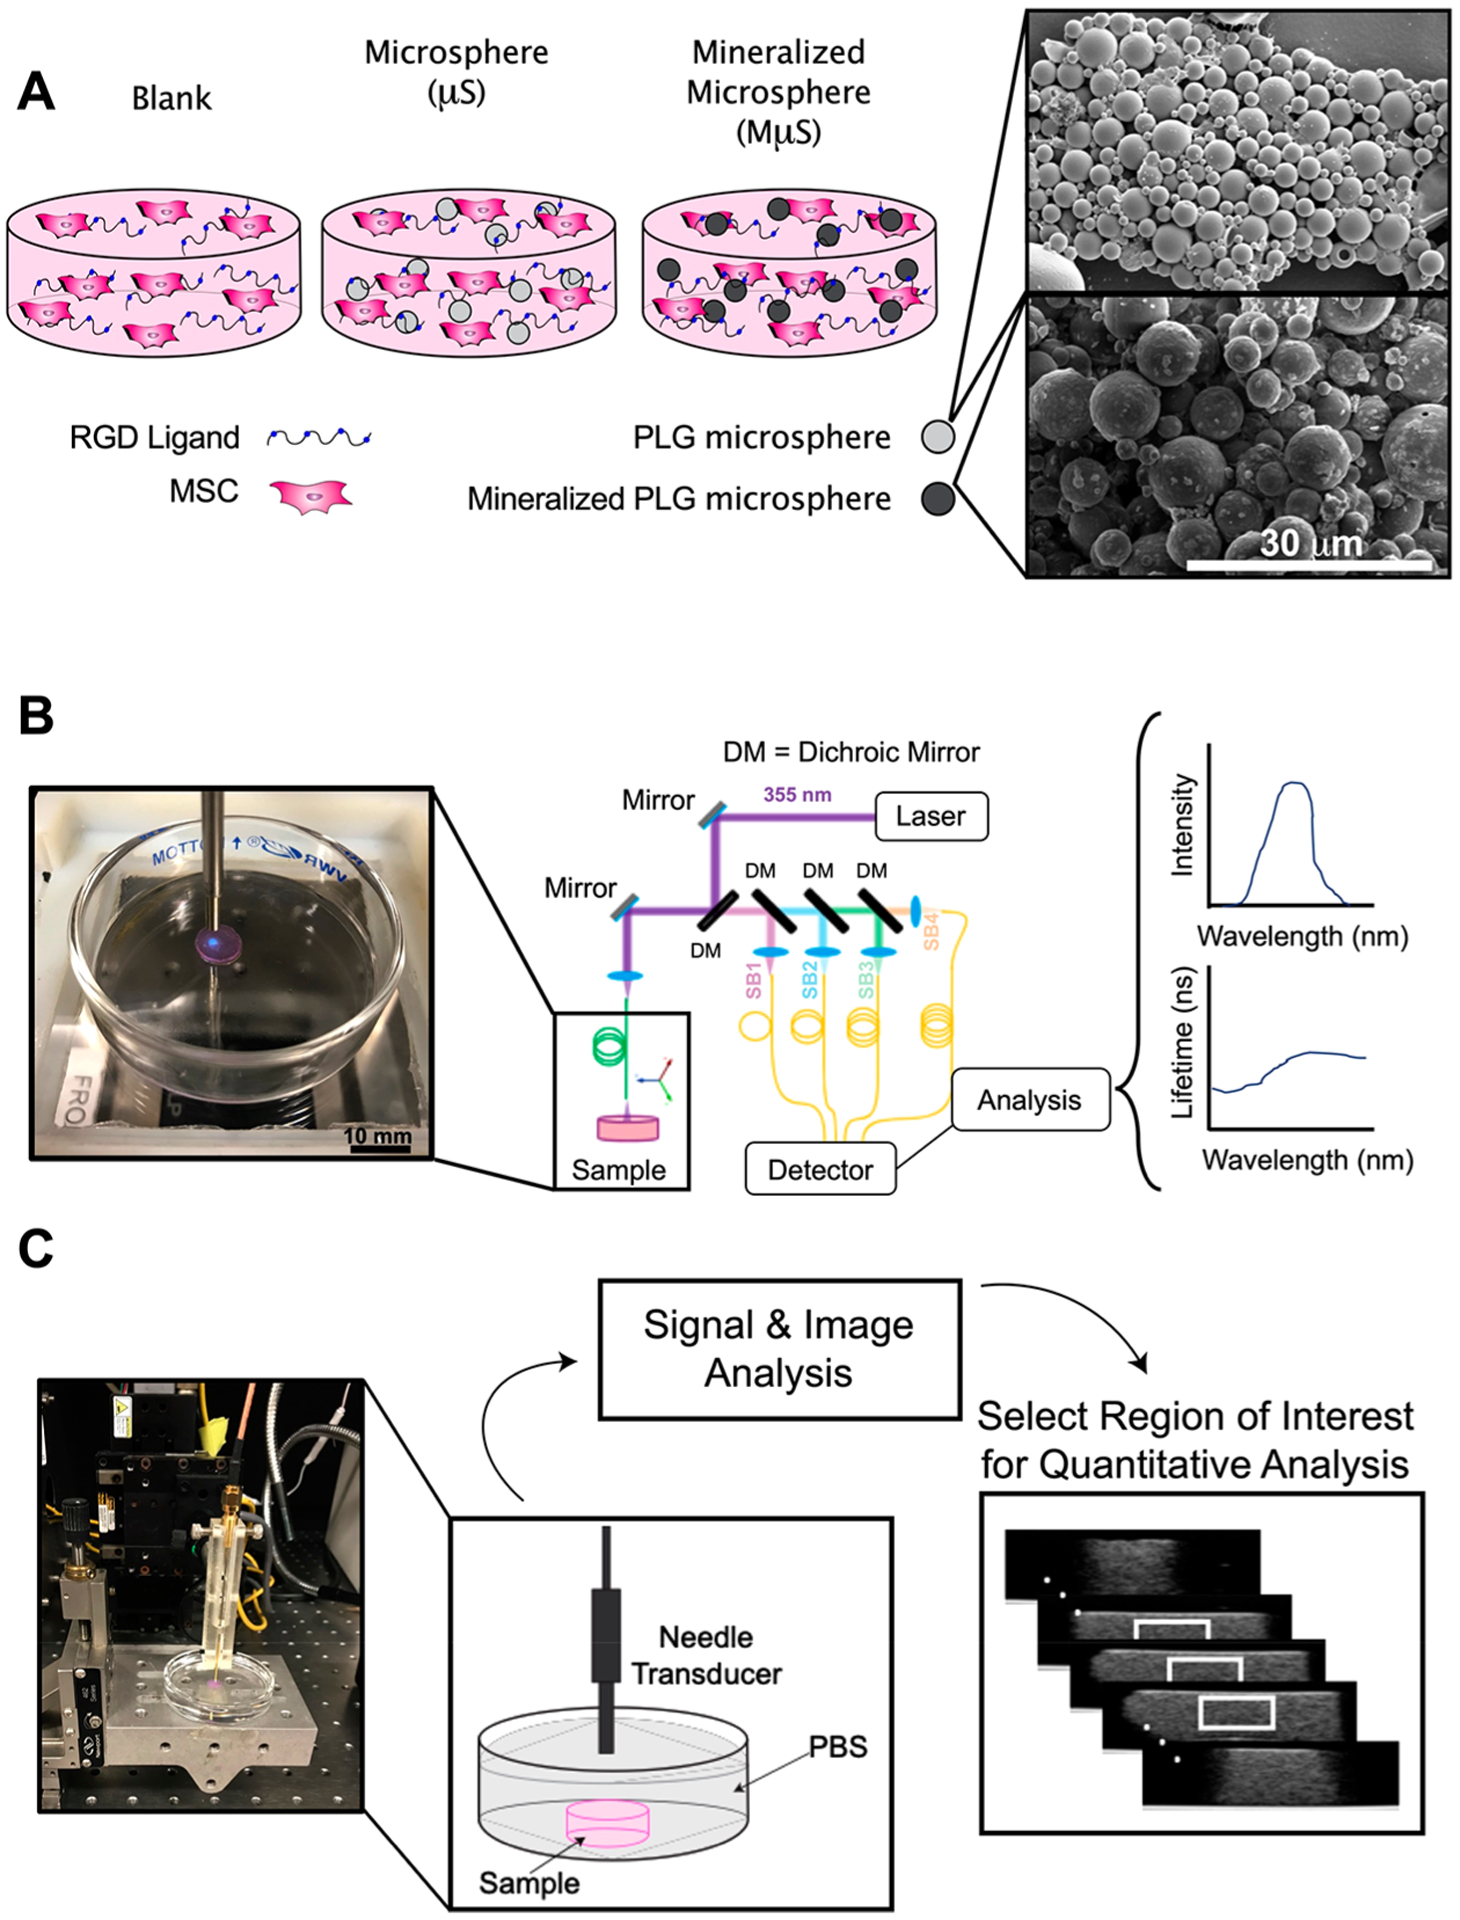
Figure 1.

Schematic representation of experimental approach. (A) Schematic of hydrogel composition (left) and scanning electron microscope images of microparticles (right). Scale bar represents 30 μm. (B) Fluorescence lifetime imaging (FLIm) of hydrogel sample showing data acquisition of autofluorescence (blue light) and schematic of data acquisition, processing, and display. (C) Photograph of ultrasound backscatter microscopy (UBM) acquisition and schematic of data processing to illustrate region of interest (white box) for radiofrequency (RF) data analysis.
