
Figure 3.
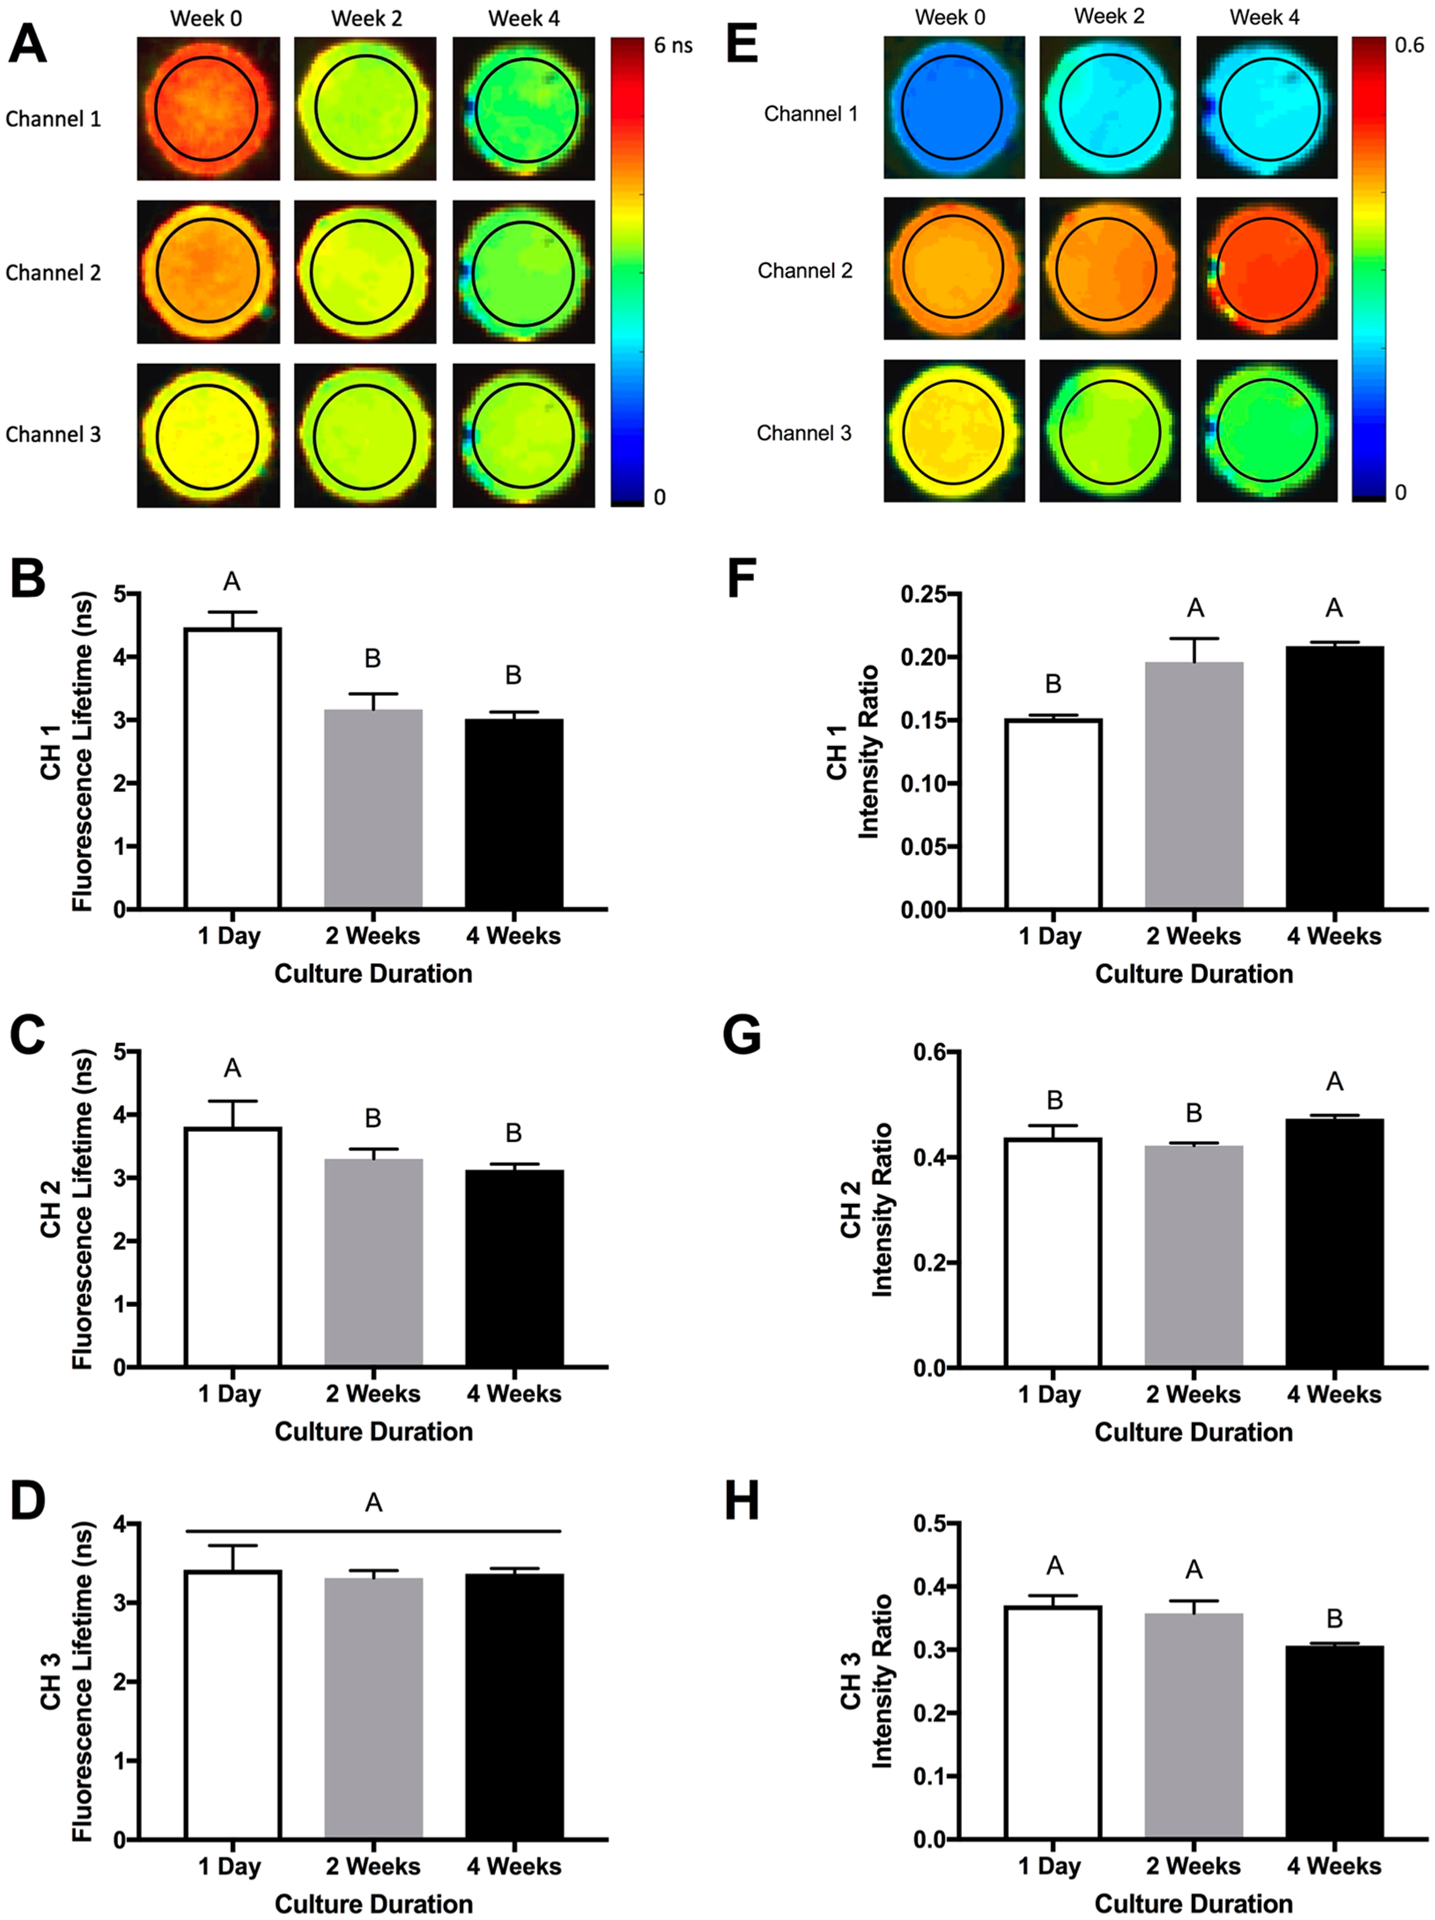
Fluorescence lifetime imaging (FLIm) detects changes in engineered constructs over time. (A) Representative color-scale images of hydrogel fluorescence lifetime over 4 weeks. FLIm measurements from the region of interest (denoted by black circle) were used to quantify average fluorescence lifetime. Fluorescence lifetime measurements in (B) channel 1, (C) channel 2, and (D) channel 3 over 4 weeks. (E) Representative color-scaled images of hydrogel fluorescence intensity ratio over 4 weeks. Fluorescence measurements from the region of interest (denoted by black circle) were used to quantify the fluorescence intensity ratios. Fluorescence intensity ratio in (F) channel 1, (G) channel 2, and (H) channel 3 over 4 weeks (average n = 7 ± standard deviation).