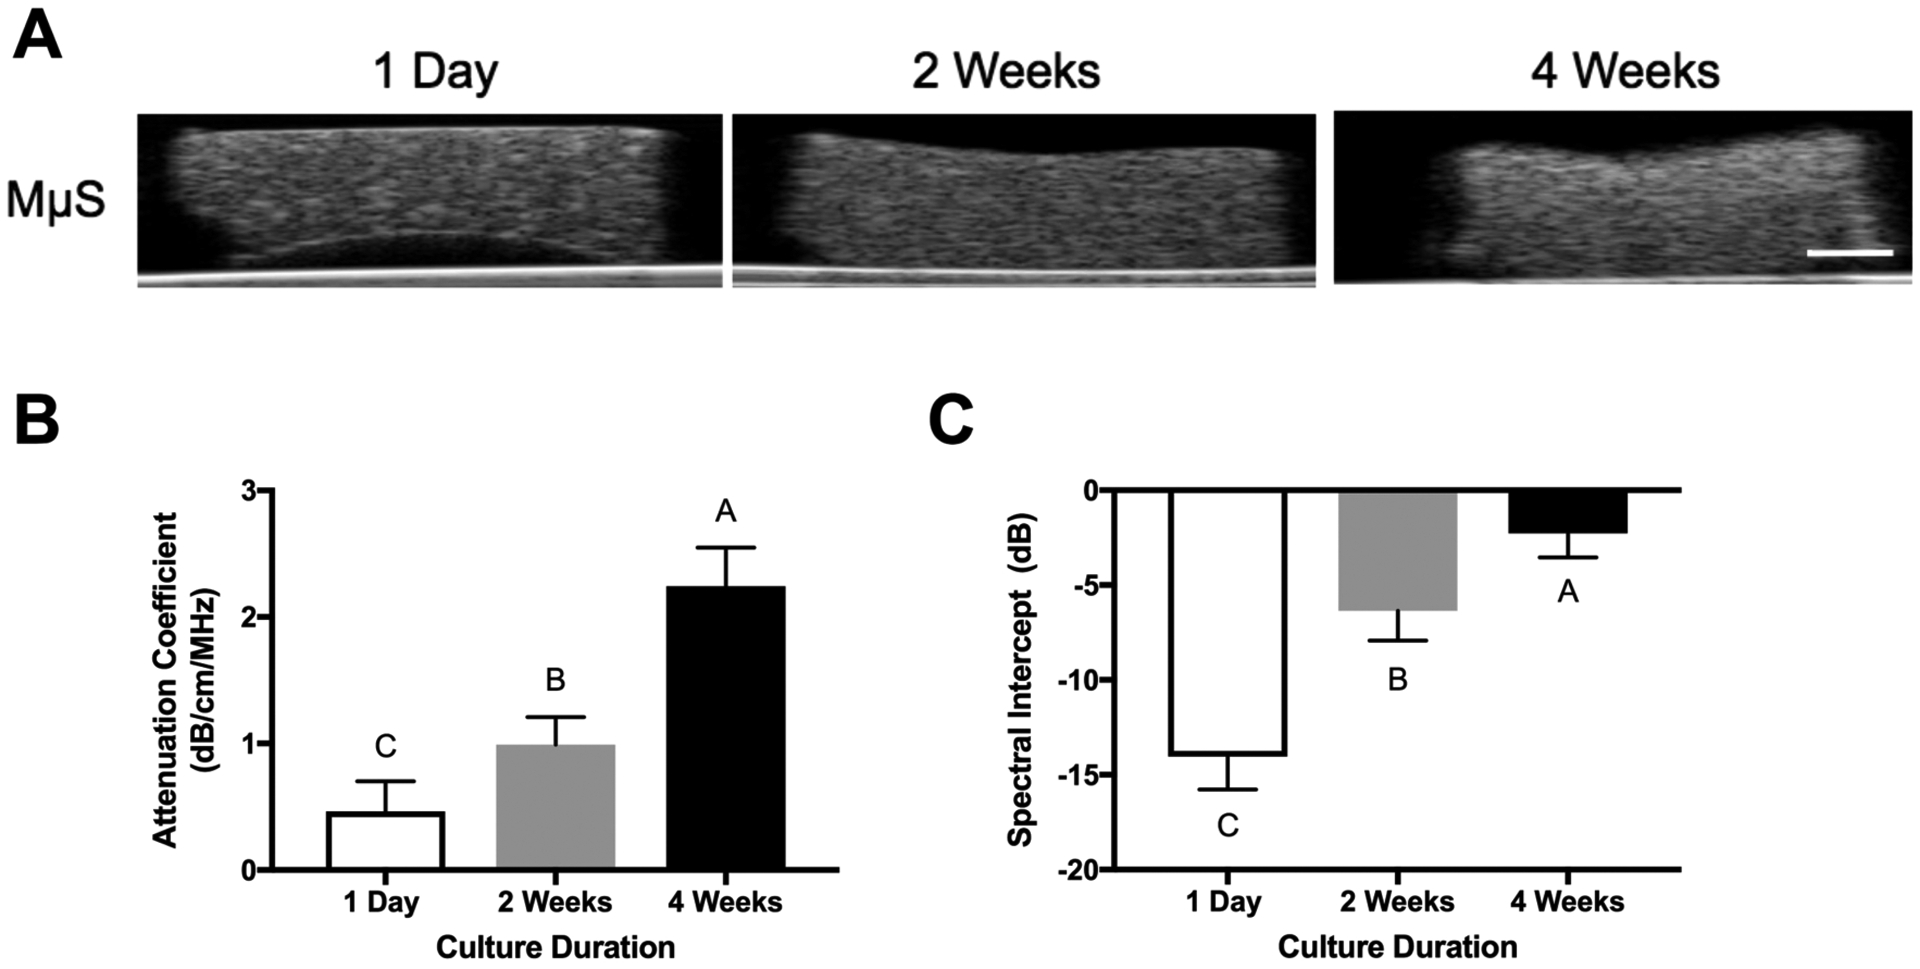
Figure 4.

Ultrasound backscatter microscopy detects differences in engineered osteogenic constructs over time. (A) Representative UBM images of constructs (70 dB dynamic range, scale bar represents 1 mm). (B) Attenuation coefficient and (C) spectral intercept of engineered constructs over 4 weeks (n = 5–7 samples per measurement).
