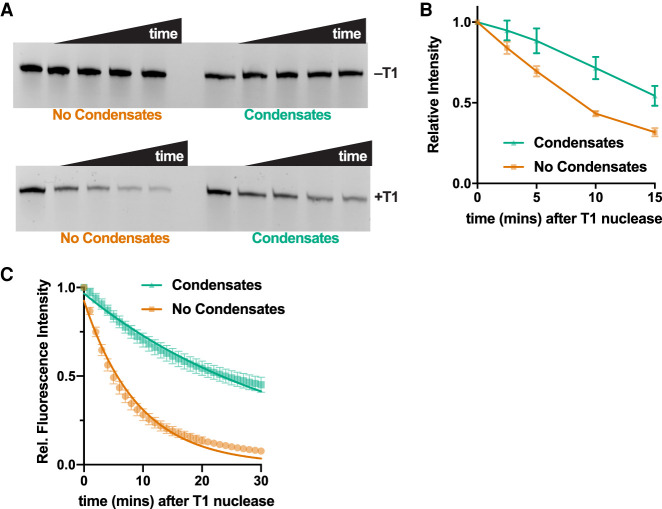
FIGURE 7.
RNA condensates protect RNA from RNase T1-mediated degradation. (A, top) Denaturing polyacrylamide gel image showing full-length Gdn RNA (3′-CF488-labeled) over time in solution or as condensates without (top row) and with (bottom row) 0.3 U RNase T1. Time points are 0, 2.5, 5, 10, and 15 min. (B) Quantification of data in panel A. Error bars represent standard error n = 5. (C) Fluorescence of the broccoli aptamer as a function of time after addition of RNase T1 nuclease to Gdn Broc RNA. The RNA was either present in solution (orange) or as condensates (green). Error bars represent standard error (n = 4). Fluorescence values were normalized to intensities at 0 min. Fitting the data to first order exponential decay (Equation 1, see Materials and Methods) provide observed rate constants of 0.03 and 0.11 min−1 for condensate and no condensate samples, respectively.

