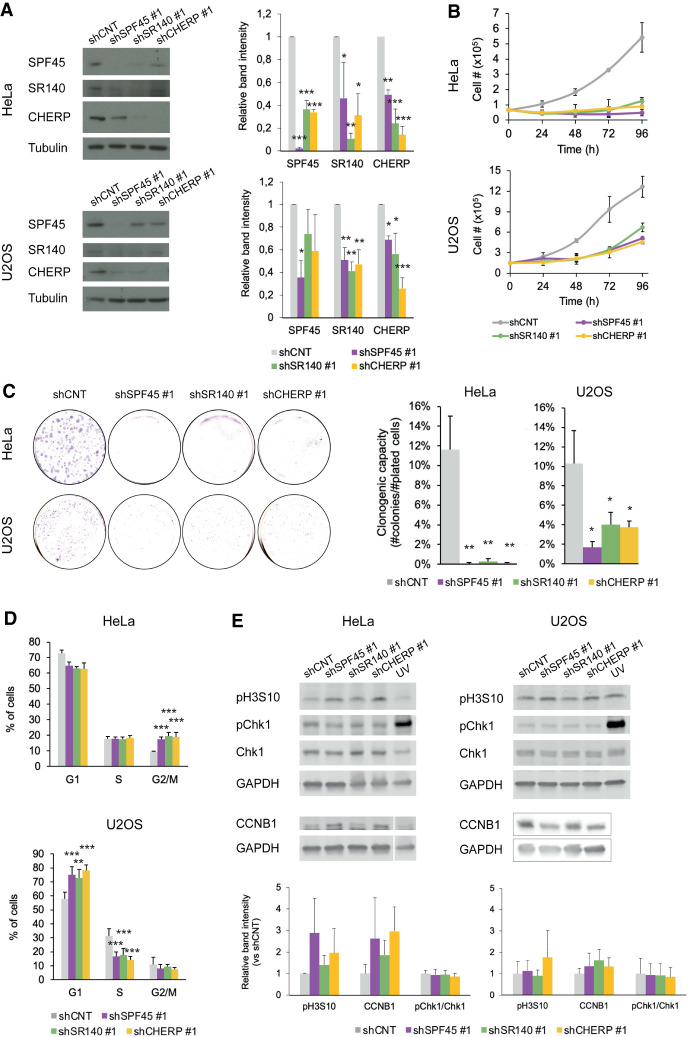
FIGURE 3.
The SPF45/SR140/CHERP complex is required for cell proliferation, cell-cycle progression, and inhibition of apoptosis. (A, left panels) Western blot analyses of SPF45, SR140, or CHERP (and tubulin as a loading control) upon their individual knockdowns using lentiviral transduction of shRNAs in HeLa and U2OS cells. The results shown are representative of three independent experiments, which are quantified in the right panels and represented as mean ± SD with P-values calculated comparing to shCNT by one-way ANOVA followed by Dunnett's multiple comparison test ([*] P < 0.05; [**] P < 0.001; [***] P < 0.0001). (B) Cell proliferation measured by direct cell number count of HeLa or U2OS cells upon lentivirus-mediated knockdown of SPF45, SR140, or CHERP measured 24, 48, 72, and 96 h after plating. Data are represented as mean ± SD of three biological replicates. (C, left) Representative clonogenic assays (left) of HeLa or U2OS cells upon lentivirus-mediated knockdown of SPF45, SR140, or CHERP. (C, right) Quantification of the number of colonies formed after seeding 1000 HeLa or 2000 U2OS cells, represented as mean ± SD of three biological replicates with P-values calculated comparing to shCNT by one-way ANOVA followed by Dunnett's multiple comparison test ([*] P < 0.01; [**] P < 0.001; [***] P < 0.0001). (D) Distribution of HeLa or U2OS cells in different phases of cell cycle upon lentivirus-mediated knockdown of SPF45, SR140, or CHERP, analyzed by propidium iodide (PI) staining and flow cytometry. Data are represented as mean ± SD of three biological replicates with P-values calculated comparing to shCNT by χ2 test ([*] P < 0.01; [**] P < 0.001; [***] P < 0.0001). (E, upper panels) Western blot analysis of the indicated cell-cycle markers (and GAPDH as loading control) upon knockdown of SPF45, SR140, or CHERP or upon treatment with UV light (UV-C at 10 J/m2 for 6 h) as a control of Chk1 phosphorylation. (Lower panels) Quantification of the results, represented as mean ± SD of three biological replicates.

