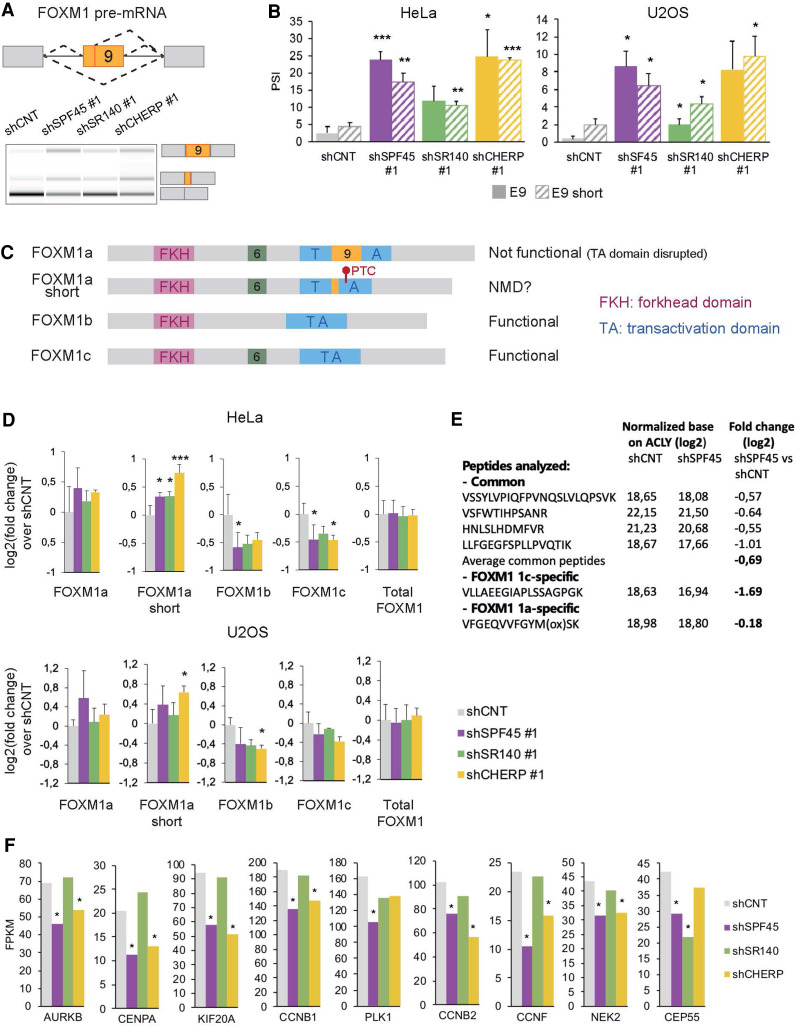
FIGURE 5.
SPF45/SR140/CHERP regulate FOXM1 AS. (A) Scheme of AS events involving FOXM1 exon 9 (upper panel) and their changes upon knockdown of SPF45, SR140, or CHERP measured by RT-PCR followed by capillary electrophoresis (lower panel). The isoform identity of the amplification products is indicated. (B) Validation of FOXM1 exon 9 AS events (solid bars: full exon inclusion; striped bars: shorter exon inclusion) changes measured as in A in HeLa and U2OS cells. Data are represented as mean ± SD of three biological replicates, and P-values are calculated comparing to shCNT by Student's t-test ([*] P < 0.05; [**] P < 0.01; [***] P < 0.001). (C) Structural domain organization of FOXM1 isoforms. The different domains are indicated as well as the location and likely functional impact of inclusion of sequences corresponding to exon 6 and exon 9 inclusion. PTC: premature termination codon. (D) Fold change over shCNT of mRNA levels of FOXM1 isoforms and total FOXM1 quantified by RT-qPCR upon knockdown of SPF45, SR140, or CHERP in HeLa and U2OS cells. Data are represented as mean ± SD of three biological replicates, and P-values are calculated by comparing to shCNT by one-way ANOVA followed by Dunnett's multiple comparison test ([*] P < 0.05; [**] P < 0.01; [***] P < 0.001). (E) Relative abundance of the indicated common or isoform-specific peptides in control versus SPF45-depleted cells by targeted proteomics, normalized by the levels of ACLY, and corresponding fold changes (in log2) between the two conditions. (F) Relative expression levels of known targets of transcriptional activation by FOXM1, quantified by Cuffdiff in RNA-seq data sets of knockdown of SPF45, SR140, or CHERP in HeLa cells. Gene expression is displayed as FPKM values (y-axis) and significant values—according to Cuffdiff differential gene expression test—are indicated by an asterisk. See also Supplemental Figure S7.

