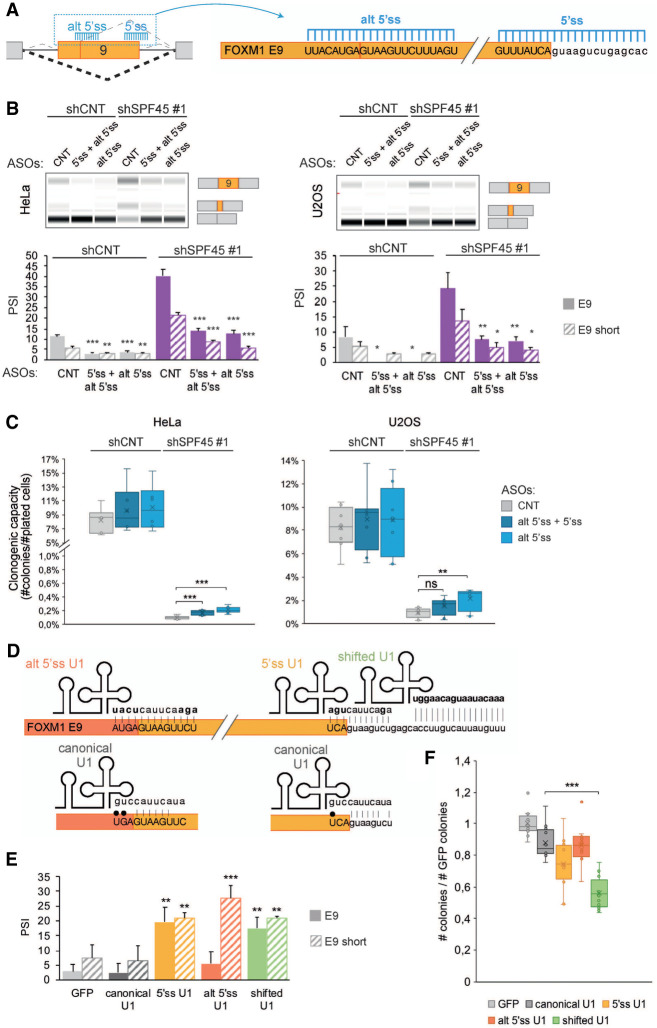
FIGURE 6.
AS of the SPF45/SR140/CHERP target FOXM1 exon 9 influences cell proliferation. (A) Schematic diagram of antisense oligonucleotides (AONs) targeting FOXM1 exon 9 5′ss and alternative 5′ss to promote exon skipping. Upper/lower case indicates exonic/intronic nucleotides, respectively. (B, upper panels) FOXM1 exon 9 isoforms inclusion (PSI) upon FOXM1 AONs (50 nM) transfection after SPF45 knockdown, assessed by RT-PCR and capillary electrophoresis. AONs predicted not to target human sequences (control), targeting the alternative 5′ss of FOXM1 and an equimolar combination of AONs targeting the 5′ss and alternative 5′ss (total 50 nM) were used in HeLa and U2OS cells. (Lower panel) quantification of these results, represented as mean ± SD of four biological replicates; P-values were calculated by Student's t-test ([*] P < 0.05; [**] P < 0.01) comparing the PSI values to those for CNT AON within each condition. (C) Percentage of plated cells forming colonies (clonogenic capacity, y-axis) upon FOXM1 AONs (50 nM) transfections in HeLa and U2OS cells knocked down for SPF45. Data are represented as mean ± SD of four biological replicates, and P-values are calculated by one-way ANOVA followed by Dunnett's multiple comparison test (ns = not significant; [**] P < 0.001; [***] P < 0.0001). (D) Schematic representation of predicted base-pairing interactions for canonical U1 snRNA and for engineered U1 snRNAs (alt 5′ss U1, 5′ss U1, and shifted U1) with FOXM1 exon 9 alternative 5′ss, 5′ss and downstream intronic region. Bases in bold indicate sequences different from the canonical U1 sequence and black dots depict wobble base-pairings. (E) Quantification of FOXM1 exons 9 inclusion (PSI) upon transfection of wild type or variant U1 snRNAs, measured by RT-PCR and capillary electrophoresis in HeLa cells. Cells were cotransfected with a GFP plasmid to allow sorting of GPF-positive cells, which coexpress U1 snRNAs, 24 h after transfection. Data are represented as mean ± SD of three biological replicates, and P-values are calculated comparing to GFP by Student's t-test ([**] P < 0.01; [***] P < 0.001). (F) Clonogenic assay of GFP-positive HeLa cells sorted 24 h after cotransfection of GFP- and U1 snRNA-expressing plasmids. The number of colonies is normalized to that of control samples transfected only with the GFP plasmid (y-axis). Data are represented as mean ± SD of three biological replicates, and P-values are calculated by one-way ANOVA followed by Dunnett's multiple comparison test ([***] P < 0.0001). See also Supplemental Figure S7.

