FIGURE 1.
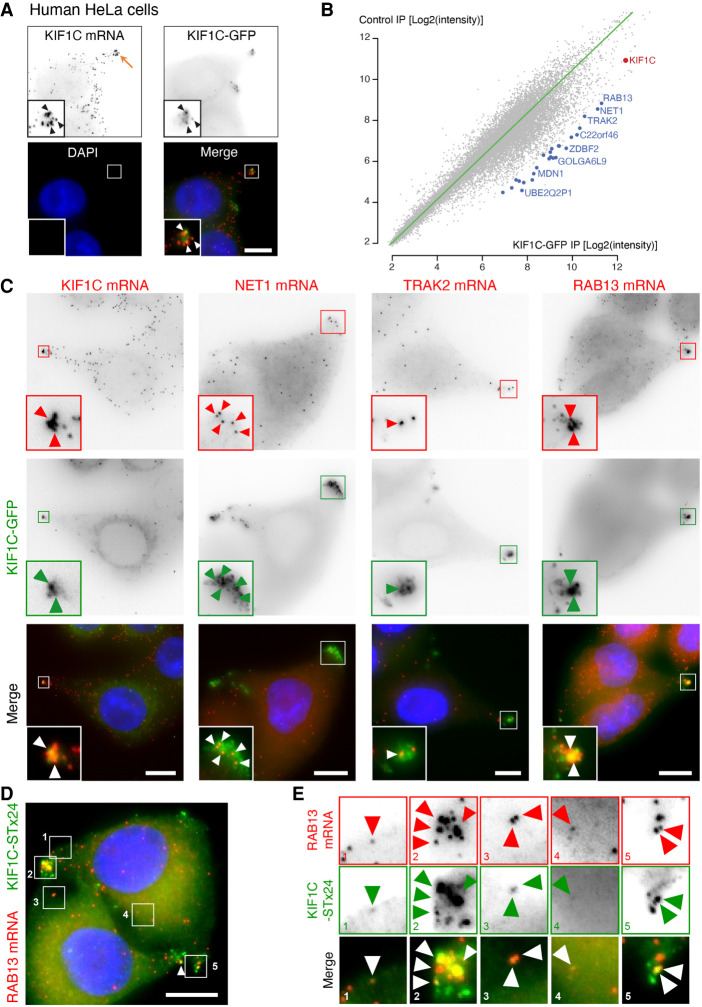
Identification of mRNAs associated with the KIF1C motor. (A) The KIF1C kinesin colocalizes with its mRNA in protrusions of HeLa cells. Images are micrographs of a H9 FlipIn HeLa cell line stably expressing a KIF1C-GFP cDNA. (Top left) KIF1C mRNA detected by smFISH with probes against the endogenous mRNA; (top right) KIF1C-GFP protein; (bottom left) DNA stained with DAPI; (bottom right) merge of the two signals with the KIF1C-GFP protein in green and KIF1C mRNA in red. Orange arrow: a cell protrusion. Blue: DNA stained with DAPI. Scale bar: 10 microns. Insets represent zooms of the boxed areas in the merge panel. White and black arrowheads indicate the colocalization of KIF1C mRNA with KIF1C-GFP protein. (B) Transcripts associating with the KIF1C-GFP protein. The graph depicts the microarray signal intensity of RNAs detected in a KIF1C-GFP pull-down (x-axis), versus the control IP (y-axis). Each dot represents an mRNA. Red dot: KIF1C mRNA; blue dot: mRNAs enriched in the KIF1C-GFP IP. N = 2. (C) Colocalization of KIF1C-GFP with KIF1C, NET1, TRAK2, and RAB13 mRNAs. Images are micrographs of HeLa H9 Flip-In cells stably expressing a KIF1C-GFP cDNA, labeled by smiFISH with probes against the indicated mRNAs. (Top) Cy3 fluorescent signals corresponding to endogenous KIF1C, NET1, TRAK2, and RAB13 mRNAs. (Middle) KIF1C-GFP signal. (Lower) Merge with the Cy3 signal in red and GFP signal in green. Blue: DNA stained with DAPI. Scale bar: 10 microns. Arrowheads indicate accumulation of single mRNA molecules at cell protrusions. (D) Single-molecule colocalization of KIF1C-ST-x24 with RAB13 mRNAs. Images are micrographs of Hela cells stably expressing KIF1C-STx24 and scFv-GFP. Red: Cy3 fluorescent signals corresponding to RAB13 mRNAs labeled by smiFISH with probes against endogenous RAB13 mRNA. Green: GFP signal corresponding to single molecules of KIF1C protein. Blue: DNA stained with DAPI. Scale bar: 10 microns. (E) Insets represent zooms of the numbered areas from panel D. Legend as in D. Arrowheads indicate molecules of RAB13 mRNA and KIF1C-STx24 protein. Micrographs show cells representative of the population.

