FIGURE 6.
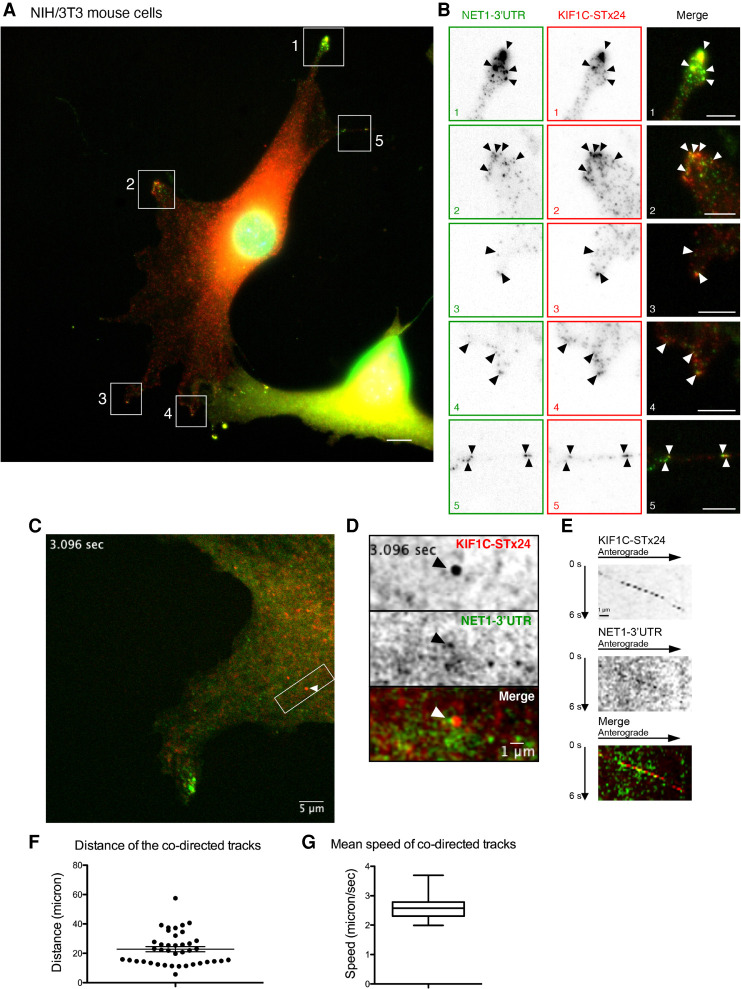
The KIF1C motor transports mRNAs containing the Net1 3′UTR to cell protrusions. (A) Images are micrographs of fixed NIH/3T3 cells expressing the β24bs/Net1 reporter mRNA, MCP-GFP (green), KIF1C-STx24 protein, and scFv-mScarletI (red). Single molecules of the β 24bs/Net1 reporter mRNA are visible in green, while single molecules of KIF1C-STx24 protein are red. The numbered white boxes are magnified in B. Blue: DNA stained with DAPI. Scale bar is 5 microns. (B) Insets represent magnifications of the boxed areas from the image shown in A. (Left) MCP-GFP signals labeling β24bs/Net1 mRNAs; (middle) scFv-mScarletI labeling KIF1C-STx24 protein; (right) merge with mRNAs in green and KIF1C-STx24 in red. Black and white arrowheads indicate colocalization of single molecules of β24bs/Net1 mRNAs and KIF1C-STx24. Scale bar is 5 microns. (C) Snapshot of a live NIH/3T3 cell expressing β24bs/Net1 mRNA, MCP-GFP (green), KIF1C-STx24 protein, and scFv-mScarletI (red). Snapshot is extracted from Supplemental Movie S9. The white arrowhead indicates a cotransport event of a single molecule of β24bs/Net1 mRNA (green) with a KIF1C-STx24 protein (red). The boxed area is magnified in panels D and E. Scale bar is 5 microns. (D) Magnification of the boxed area in panel C, highlighting a cotransport event. (Top) KIF1C-STx24; (middle) β24bs/Net1 mRNA; (bottom) merged panel with the β24bs/Net1 mRNA in green and KIF1C-STx24 in red. Scale bar is 1 micron. (E) Kymograph from Supplemental Movie S9, showing the trajectory of a single molecule of KIF1C-STx24 (top panel), a single molecule of β24bs/Net1 mRNA (middle panel), and the merge (bottom panel). The cellular area shown corresponds to panel D. (F) The graph depicts the distance traveled by cotransported molecules of KIF1C-STx24 and β24bs/Net1 mRNA. Each data point is a track (40 tracks in total), and the mean and 95% confidence intervals are shown by horizontal lines. Source data are provided in Supplemental Table S4. (G) Boxplot depicting the mean speed of cotransported molecules of KIF1C-STx24 and β24bs/Net1 mRNA in NIH/3T3 cells. Speed is microns/second. The vertical bars display the first and last quartile, the box corresponds to the second and third quartiles, and the horizontal line to the mean (40 tracks in total). Source data are provided in Supplemental Table S4.

