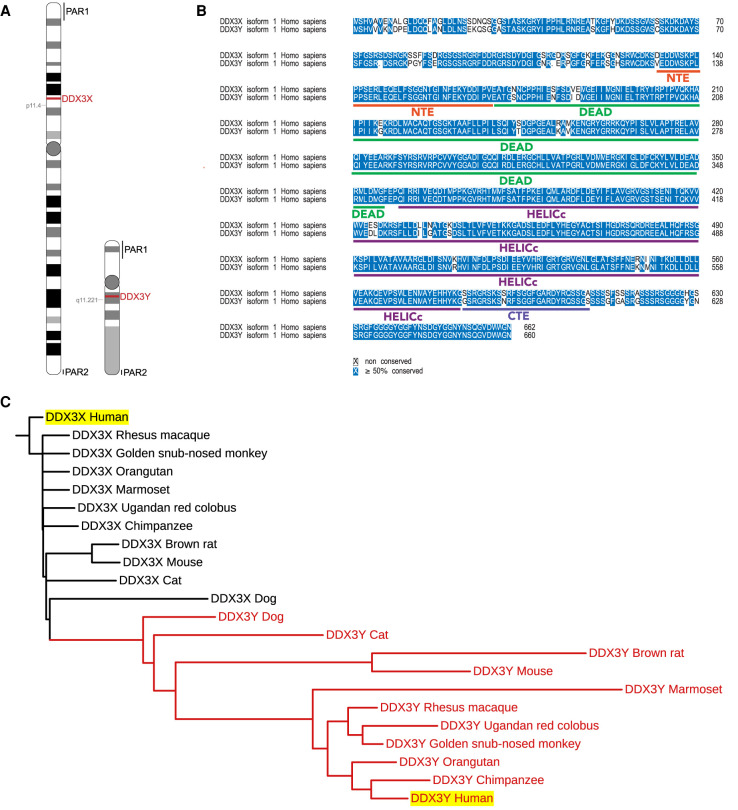
FIGURE 1.
(A) Graphic indicating the locations of DDX3X and DDX3Y on their respective chromosomes. Pseudoautosomal regions (PAR) are indicated. (B) Alignment of human DDX3X and DDX3Y demonstrating ∼92% sequence identity. Domain architecture of DDX3X is indicated. (C) Phylogenetic tree indicating distances between the sequences of DDX3X and DDX3Y in mammals (where sequence is available, only selected species indicated, see Supplemental Figure S1 for tree of all available mammalian sequences). The cluster of mammalian DDX3Y orthologs is indicated with red branches. Human orthologs are highlighted in yellow.

