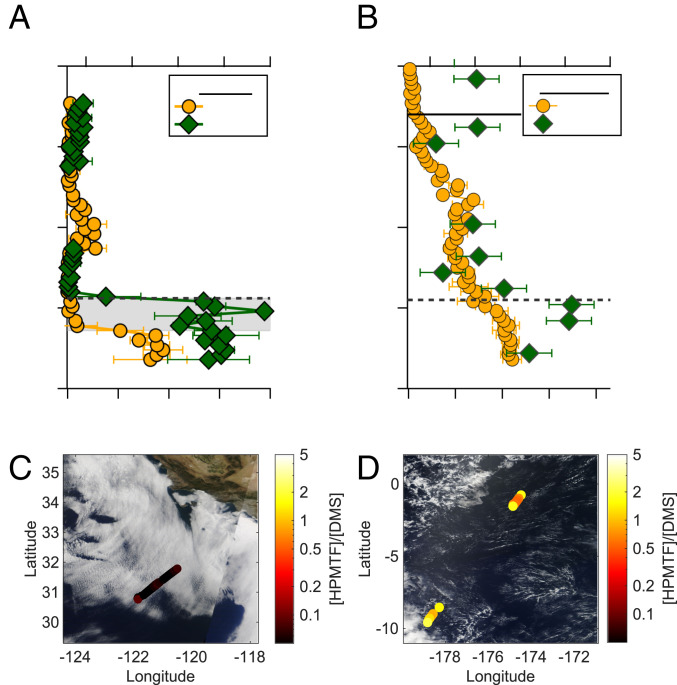
Fig. 1.
Vertical profiles of DMS and HPMTF mixing ratios under cloudy (A) and clear sky conditions (B) observed during the SARP and ATom research flights, respectively. The gray shaded region in A represents the cloudy altitudes in the MBL. The horizontal dashed lines in A and B indicate the boundary layer height. The solid line in B indicates the BuL height. The SARP vertical profile is taken from the ascent at the end of the flux period, and the ATom profile is taken from the descent at the start of the second set of flux legs. C and D show the research flight path colored by the observed [HPMTF]/[DMS] ratio overlaid on true color images from Moderate Resolution Imaging Spectroradiometer Terra for the SARP (C) and ATom (D) flights, respectively. [HPMTF]/[DMS] in C is plotted for below cloud periods only and for altitudes below 1,500-m periods in D.

