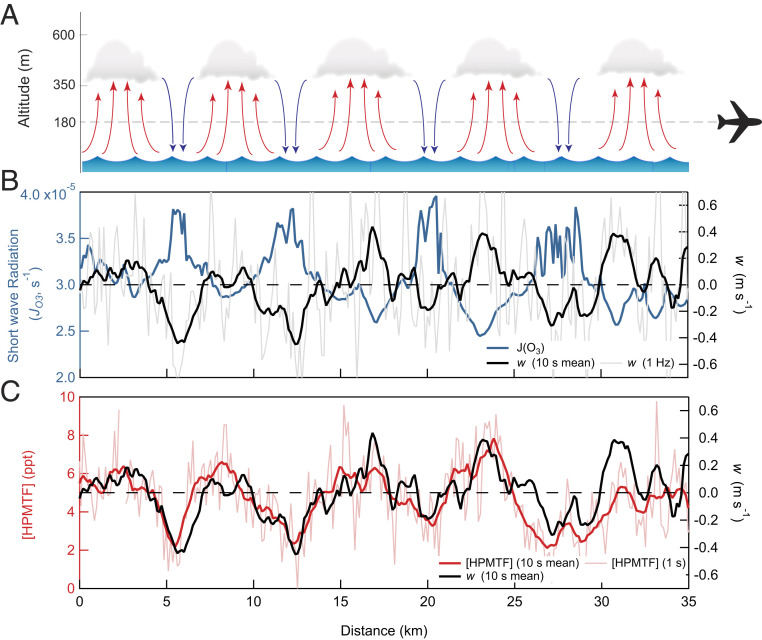
Fig. 2.
(A) Schematic of the convective roll structure observed during the SARP research flight in the cloudy MBL with periodic cloudy and clear sky regions associated with updrafts and downdrafts, respectively. (B) Time series of instantaneous vertical wind speed (w, black) and zenith ozone photolysis rates (JO3, blue), proportional to downward short wave solar radiation, indicates the cloud-free regions. (C) Time series of HPMTF mixing ratios ([HPMTF]) and w showing the depletion of HPMTF in downdraft air parcels which have experienced cloud processing. The 10-s moving average (red) and discreet 1-s time resolution (light red) HPMTF mixing ratios are included in C.

