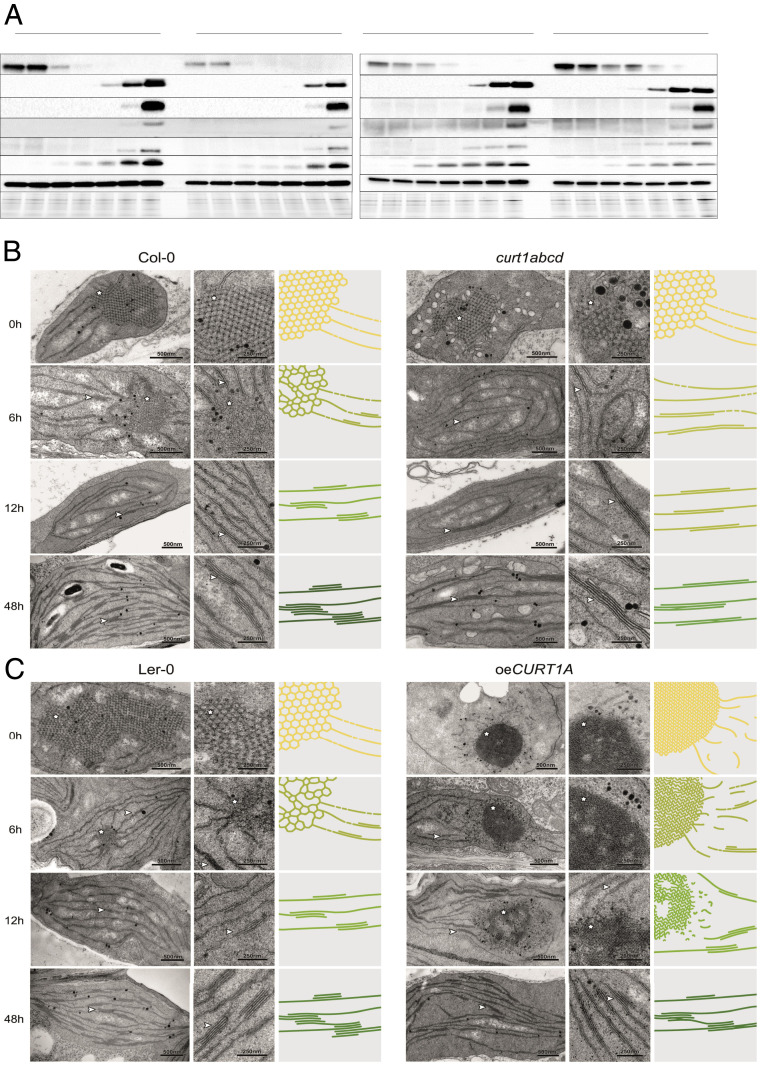
Fig. 2.
Protein profiles are affected by structural changes in PLBs and PTs in curt1abcd and oeCURT1A. (A) Protein profiles of 7-d-old seedlings were determined at 0 to 48 h of de-etiolation in the curt1abcd mutant and the corresponding WT Col-0 (Left) and in the oeCURT1A line and its respective WT control (Ler-0; Right). At each time point, 10-µg aliquots of total protein were fractionated by sodium dodecyl sulfate polyacrylamide gel electrophoresis (SDS-PAGE) and subjected to immunoblot analysis (n = 3). (B and C) Transmission electron micrographs of chloroplasts from (B) Col-0 and curt1abcd and (C) Ler-0 and oeCURT1A after 0, 6, 12, and 48 h of illumination (Left and Middle). Schematic depictions of the respective membrane morphologies (scaled by average PLB size and compactness, grana sizes, and grana thylakoid interconnectivity) are presented (Right). Note that for clarity, the PLB network is magnified threefold relative to the size of grana stacks (membrane thickness is fixed), and the color schemes depict relative levels of chlorophyll accumulating in the respective genotypes. Stars and arrowheads indicate PLBs and stacked membranes, respectively. (Scale bars, 500 nm [Left, TEM] and 250 nm [Middle, TEM magnification].)

