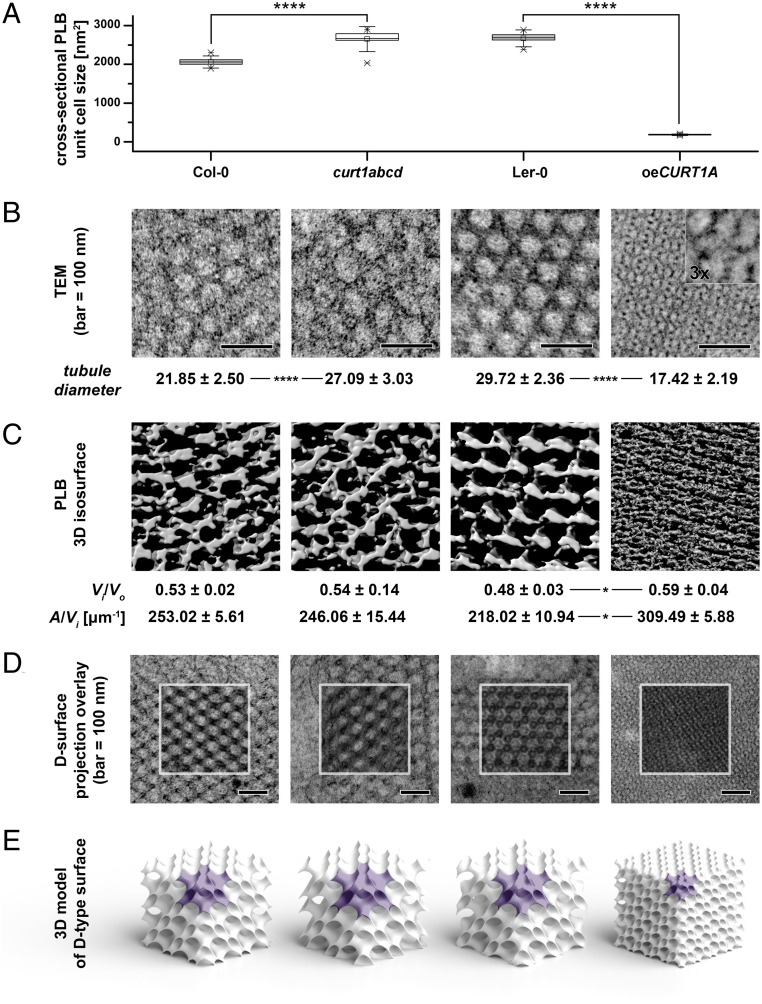
Fig. 3.
Packing and morphology of PLBs is altered by either lack or excess of CURT1 proteins. (A) Mean cross-sectional areas of the unit cells of paracrystalline PLB lattices calculated from transmission electron micrographs of Col-0, curt1abcd, Ler-0, and oeCURT1A. Error bars represent the SD. Col-0 was compared with curt1abcd and Ler-0 with oeCURT1A by two-way ANOVA with Bonferroni posttest; ****P < 0.001. (B) Sections obtained from Col-0, curt1abcd, Ler-0, and oeCURT1A and examined by TEM. The tubule diameters for Col-0, curt1abcd, Ler-0, and oeCURT1A are indicated below each image. (C) 3D isosurface reconstructions of TEM sections from Col-0, curt1abcd, Ler-0, and oeCURT1A. The spatial PLB parameters of inner-to-outer volume ratio (Vi/Vo), and area-to-inner volume ratio (A/Vi) were calculated based on PLB 3D isosurface reconstructions of electron tomographs of PLBs from Col-0, curt1abcd, Ler-0, and oeCURT1A. (D) Electron micrographs of PLB lattices and computed projections of D-type surfaces obtained with the SPIRE tool; regions marked with white squares show a superposition of computed projections and TEM images using multiply blend mode. (E) 3D spatial models of cubic D-type PLB grids generated based on parameters obtained with the SPIRE tool. Single PLB unit cells are marked with purple, and all models are shown to scale, representing actual differences between unit cell sizes and volume proportion of the PLB network in particular genotypes (n = 3 for tomograms and reconstructions).

