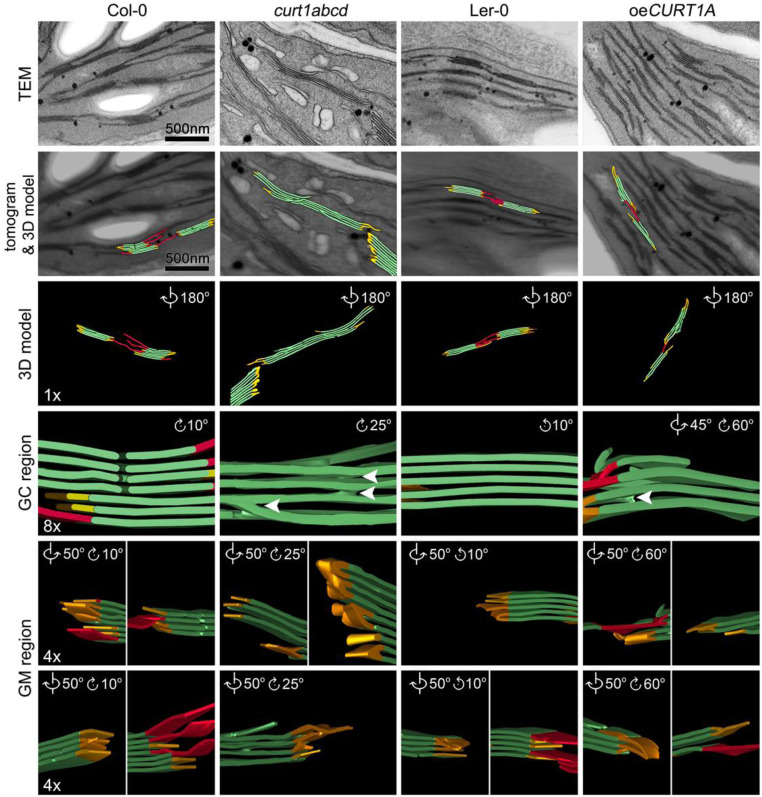
Fig. 4.
Electron tomographic reconstruction of thylakoid membranes after 48 h of illumination electron tomographic reconstructions of thylakoid membranes in Col-0 (Left), curt1abcd (Middle Left), Ler-0 (Middle Right), and oeCURT1A (Right) lines based on TEM sections. Each column shows (from Top to Bottom) the central section of the TEM stack (TEM), a surface model (colored in red for stroma thylakoids, green for grana thylakoids, and yellow for grana margins) superimposed on the reconstructed tomogram, a surface visualization shown in reversed view (3D model), and magnified and rotated views of the grana core (GC region) and grana margins (GM region). White arrowheads indicate the dichotomous splitting of the membranes observed in curt1abcd and oeCURT1A sections. Scale bars and magnifications are the same for all genotypes in each row.

