Fig. 5.
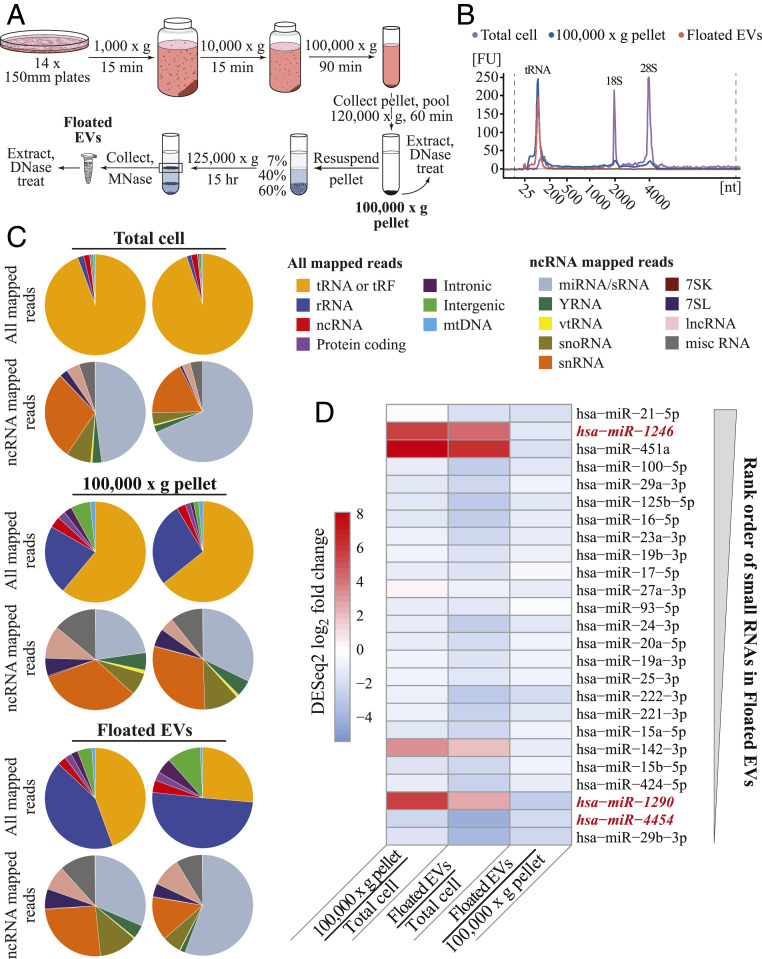
OTTR RNA-seq inventorying of EV sRNA. (A) Schematic of EV purification. (B) Agilent Bioanalyzer RNA traces for cellular RNA (purple), the 100,000 × g pellet (blue), and Floated EVs (peach). Peaks corresponding to tRNA and 18S and 28S rRNA are indicated. (C) Pie charts of mapped read assignments of MDA-MB-231 sRNA libraries from two biological replicates. tRAX and miRDeep2 were used to map tRNA and miRNA reads, respectively. rRNA, ncRNA, and protein-coding reads aligned to annotated transcripts or genomic ncRNA loci. Intronic, intergenic, and mitochondrial (mt) DNA reads mapped in corresponding locations. Among ncRNA reads, vt is vault and miscRNA includes all ncRNA not split out into other pie slices. (D) EV miRNA enrichment in MDA-MB-231 based on DESeq2 log2 fold change estimates between, as pairwise combinations, 100,000 × g pellet and Total cell, Floated EVs and Total cell, and Floated EVs and 100,000 × g pellet. The 25 miRBase sRNAs included in the panel are the most abundant in read count in MDA-MB-231 Floated EVs, with most abundant of the 25 at top as schematized by the thicker end of the gray wedge. The sequences not considered bona fide miRNA based on miRGeneDB are in red italic. The sequence of miRBase hsa-mir-142 corresponds to miRGeneDB hsa-mir-142-v3.

