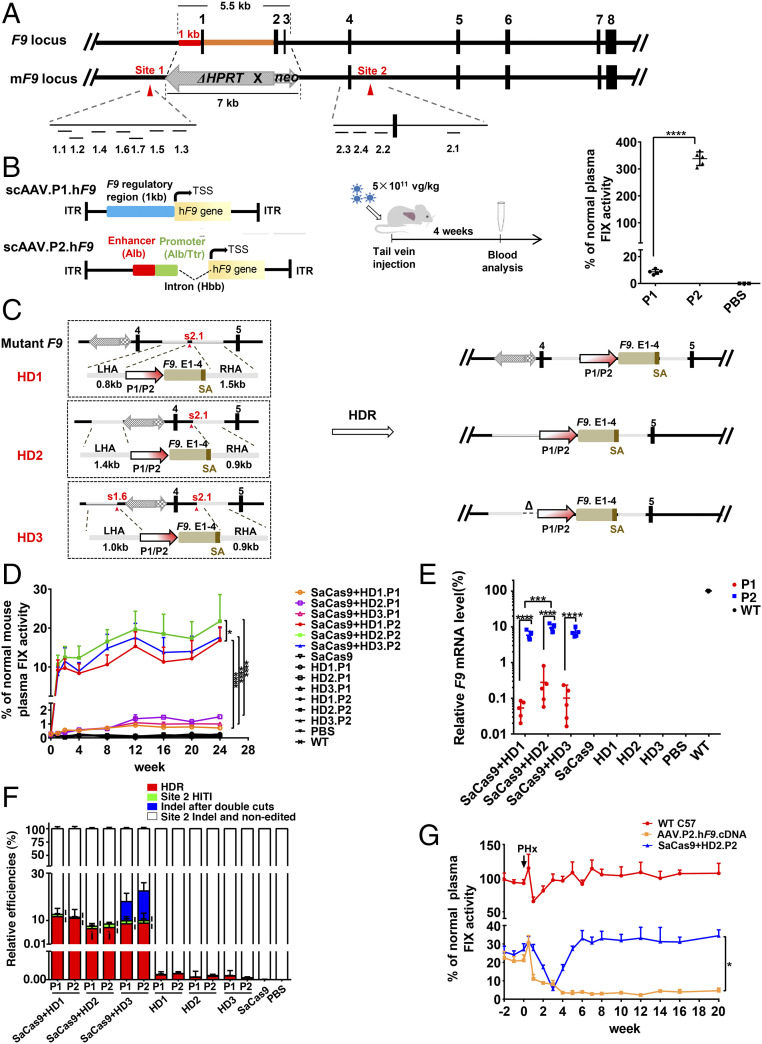
Fig. 1.
HDR-mediated P2 integration and neoΔHPRT removal ensure a stably therapeutic FIX elevation in a severe HB model. (A) Genetic structures of WT F9 and mF9. The dashes depict the locations of 11 candidate sgRNAs of target sites. (B) Structures of AAV.P1.hF9 cDNA and AAV.P2.hF9 cDNA vectors. Middle shows the flowchart of experiments (5.0 ×10¹¹ vg/kg). The plasma FIX levels in P1, P2, and PBS groups are shown in the Right graph (P1 and P2 groups, n = 5; PBS group, n = 3). (C) The Left part of the diagram depicts three protocols of HDR (HD1–HD3). The Right part illustrates the expected edited forms of mF9 post-HDR. (D) Plasma FIX activity (n = 6) was monitored over 24 wk after AAV infusion (donor-sgRNA: 2.0 × 10¹⁴ vg/kg; SaCas9: 4.0 × 10¹³ vg/kg). (E) The relative F9 mRNA levels in each group as indicated were evaluated by RT-qPCR (n = 5). (F) The primer locations that discriminate four groups of mF9 alleles from each other using qPCR (n = 5). P values (Ì) for differences between HD1.P1/2 and HD2.P1/2 HDR rates were <0.01, and the P values (¦) for the differences between the HDR rates and the site 2 HITI rates in the same groups were <0.001. (G) HB mice were intravenously injected with AAV.P2.hF9.cDNA alone (1.0 ×10¹¹ vg/kg) or with dual AAVs with HD2.P2 (HD2.P2: 2.0 × 10¹⁴ vg/kg, SaCas9: 4.0 × 10¹³ vg/kg). After 32 wk of observation of plasma FIX activity, a PHx was performed on these two groups of HB mice and a group of age-matched WT mice (n = 3). The plasma FIX activity was monitored at time points as indicated. Data are presented as mean ± SEM, *P < 0.05, ***P < 0.001, ****P < 0.0001. vg/kg, vector genomes per kilogram.

