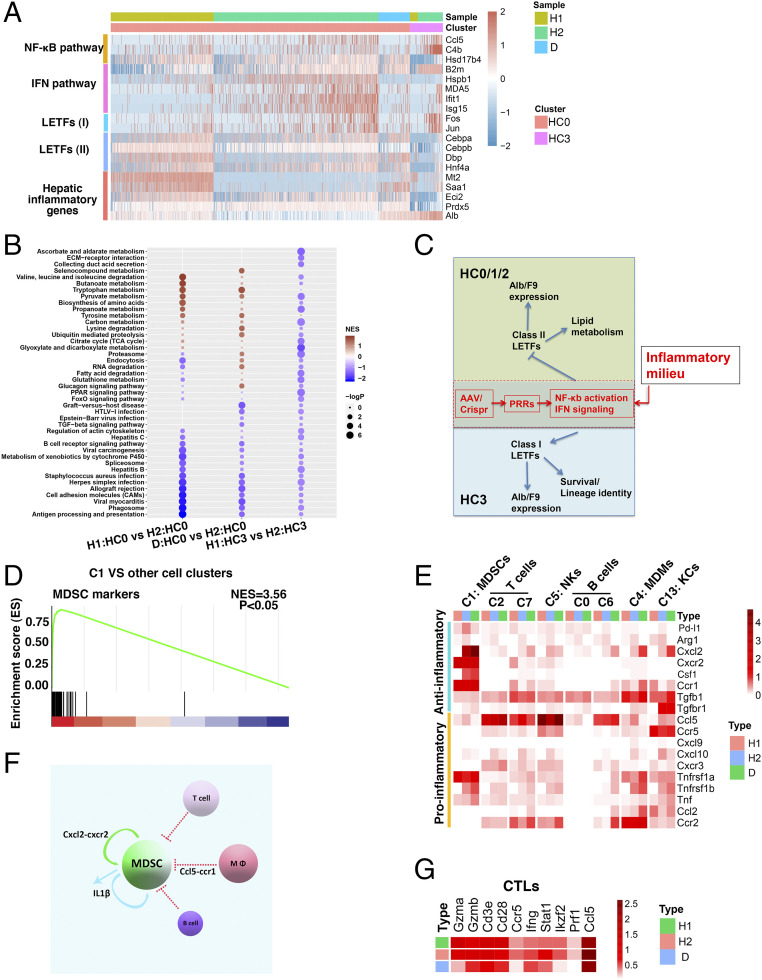
Fig. 4.
Hepatic inflammation differentially regulates F9 and Alb expressions via two specific sets of LETFs. (A) Heatmap showing expressions of the selected gene modules as indicated in HC0 and HC3 cells under the H1, H2, and D conditions. The color bar indicates log2-normalized expression. (B) GSEA analyses of H1:HC0 versus H2:HC0, D:HC0 versus H2:HC0, and H1:HC3 versus H2:HC3. (C) Hypothesis: Alb and F9 expressions indicative of hepatocyte functionality among discrete hepatocytes are driven by distinct sets of LETFs whose expressions and activities are modulated by inflammatory signaling in opposite ways. (D) GSEA analysis of C1 versus the other 15 cellular clusters in terms of MDSC signature genes. (E) Average heatmap depicting the expressional alterations of major cytokines/ligands in major hematopoietic clusters including C1:MDSCs, C2/7:T cells, C5:NK, C0/6:B cells, C4:MDMs, and C13:KCs under the H1, H2, and D conditions. (F) Diagram depicting the C1 pool regulation by two major cytokine–receptor communications pathways under the H2 or D condition. (G) Average heatmap depicting the expressional alterations of CTL effector molecules as indicated under the H1, H2, and D conditions.

