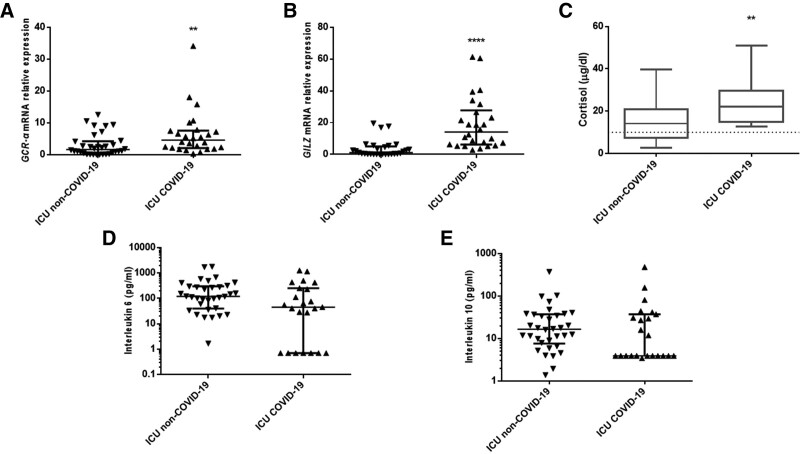
Figure 1.
Corticosteroid response in coronavirus disease 2019 (COVID-19). Distribution of glucocorticoid receptor alpha (GCR-α) (A) and glucocorticoid-inducible leucine zipper (GILZ) (B) expression in 26 COVID-19 critically ill patients and 33 non-COVID-19 critically ill patients on ICU admission. Data are presented as scatter plots. Line in the middle: median value; lower and upper lines: 25th–75th percentiles. **p < 0.01, ****p < 0.0001 by Mann-Whitney U test. C, Morning cortisol levels were measured in 26 COVID-19 critically ill patients and in 33 non-COVID-19 critically ill patients on ICU admission. Data are presented as box plots. Line in the box: median value; box edges: 25th to 75th percentiles; whiskers: range of values; horizontal line: cortisol levels 10 µg/dL. **p < 0.01 by Mann-Whitney U test. Distribution of interleukin-6 (D) and interleukin-10 (E) in 26 COVID-19 critically ill patients and 33 non-COVID-19 critically ill patients on ICU admission. Data are presented as scatter plots. Line in the middle: median value; lower and upper lines: 25th–75th percentiles. mRNA = messenger RNA.

