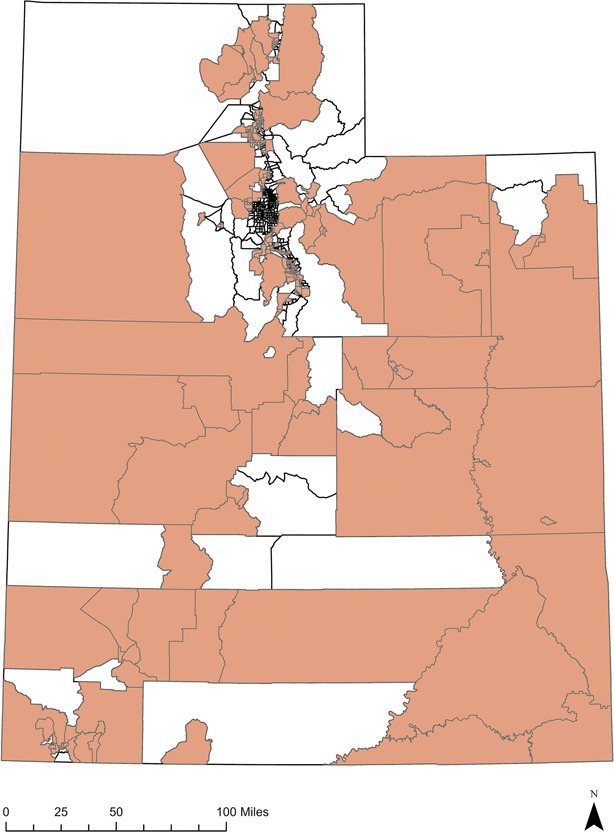
Fig. 2. Census tracts (n=235) that were in the lower participating pharmacy density group and were in the top quartile for percentages of one of Utah's marginalized groups (minority race or ethnicity, percentage of females without health insurance, and percent below the poverty line). Map created with ESRI 2021. ArcGIS Pro: Release 2.8.2. Data from State of Utah, Utah Automated Graphic Reference Center. Available at: https://gis.utah.gov/and United States Census Bureau. American Community Survey 2018 5-Year Estimates Public Use Microdata Sample File. Washington, DC. Accessed at: https://www.census.gov/programs-surveys/acs/microdata/access.2018.html.

Magnusson. Pharmacist-Prescribed Contraceptives in Utah. Obstet Gynecol 2021.
