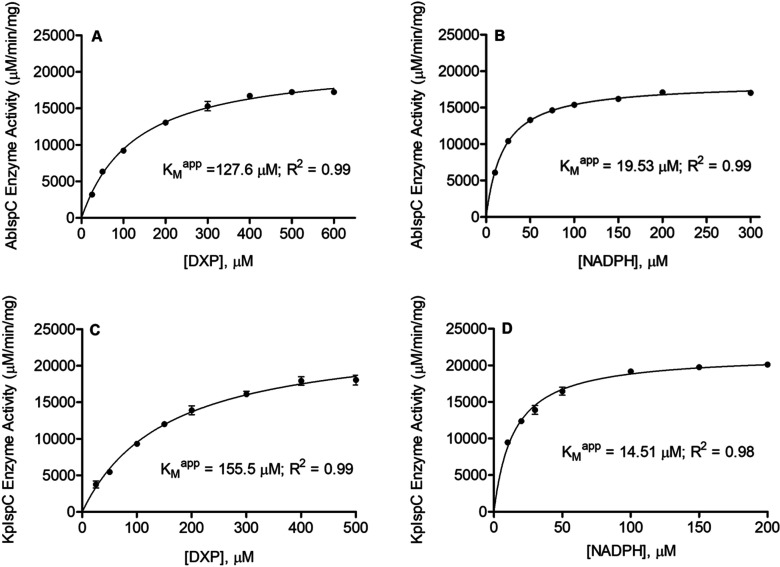
Figure 3.
Substrate dependent catalytic activity of A. baumannii and K. pneumoniae IspC. Shown are Michaelis–Menten plots of AbIspC reaction velocity as a function of (A) DXP concentration and (B) NADPH concentration. Also shown are the Michaelis–Menten plots of KpIspC reaction velocity as a function of (C) DXP concentration and (D) NADPH concentration. KMapp values were obtained using GraphPad Prism 5.0. Least-squares best fit of the data to the Michaelis–Menten equation produces the kinetic parameters depicted here and listed in Table 2. The R2 value for each plot is indicated. All assays were performed in duplicate. The error bars indicate the standard deviation for each data point.

