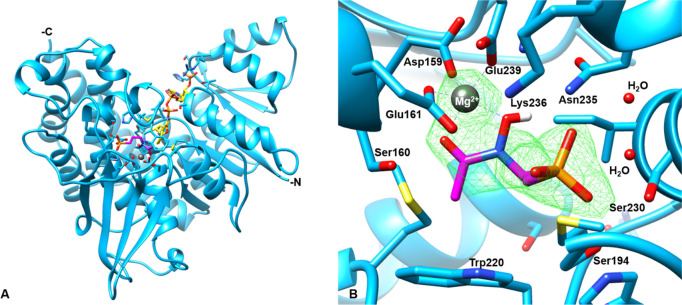
Figure 6.
Structure of the AbIspC complex. (A) The overall crystal structure of AbIspC (blue) in complex with NADPH (yellow), FR900098 (magenta), and Mg2+ (gray). The N- and C-termini are indicated. (B) Focused view of the AbIspC FR900098 and Mg2+ binding site. The Fo-Fc difference map around FR900098 and Mg2+ is shown in green mesh, contoured at a radius of 3.0 Å around the ligand. Residues 191–193 and 258 and NADPH were deleted for visualization of the binding site. Bonded waters are shown. AbIspC structure (PDB ID: 4ZN6) was used as a search model for phasing.

