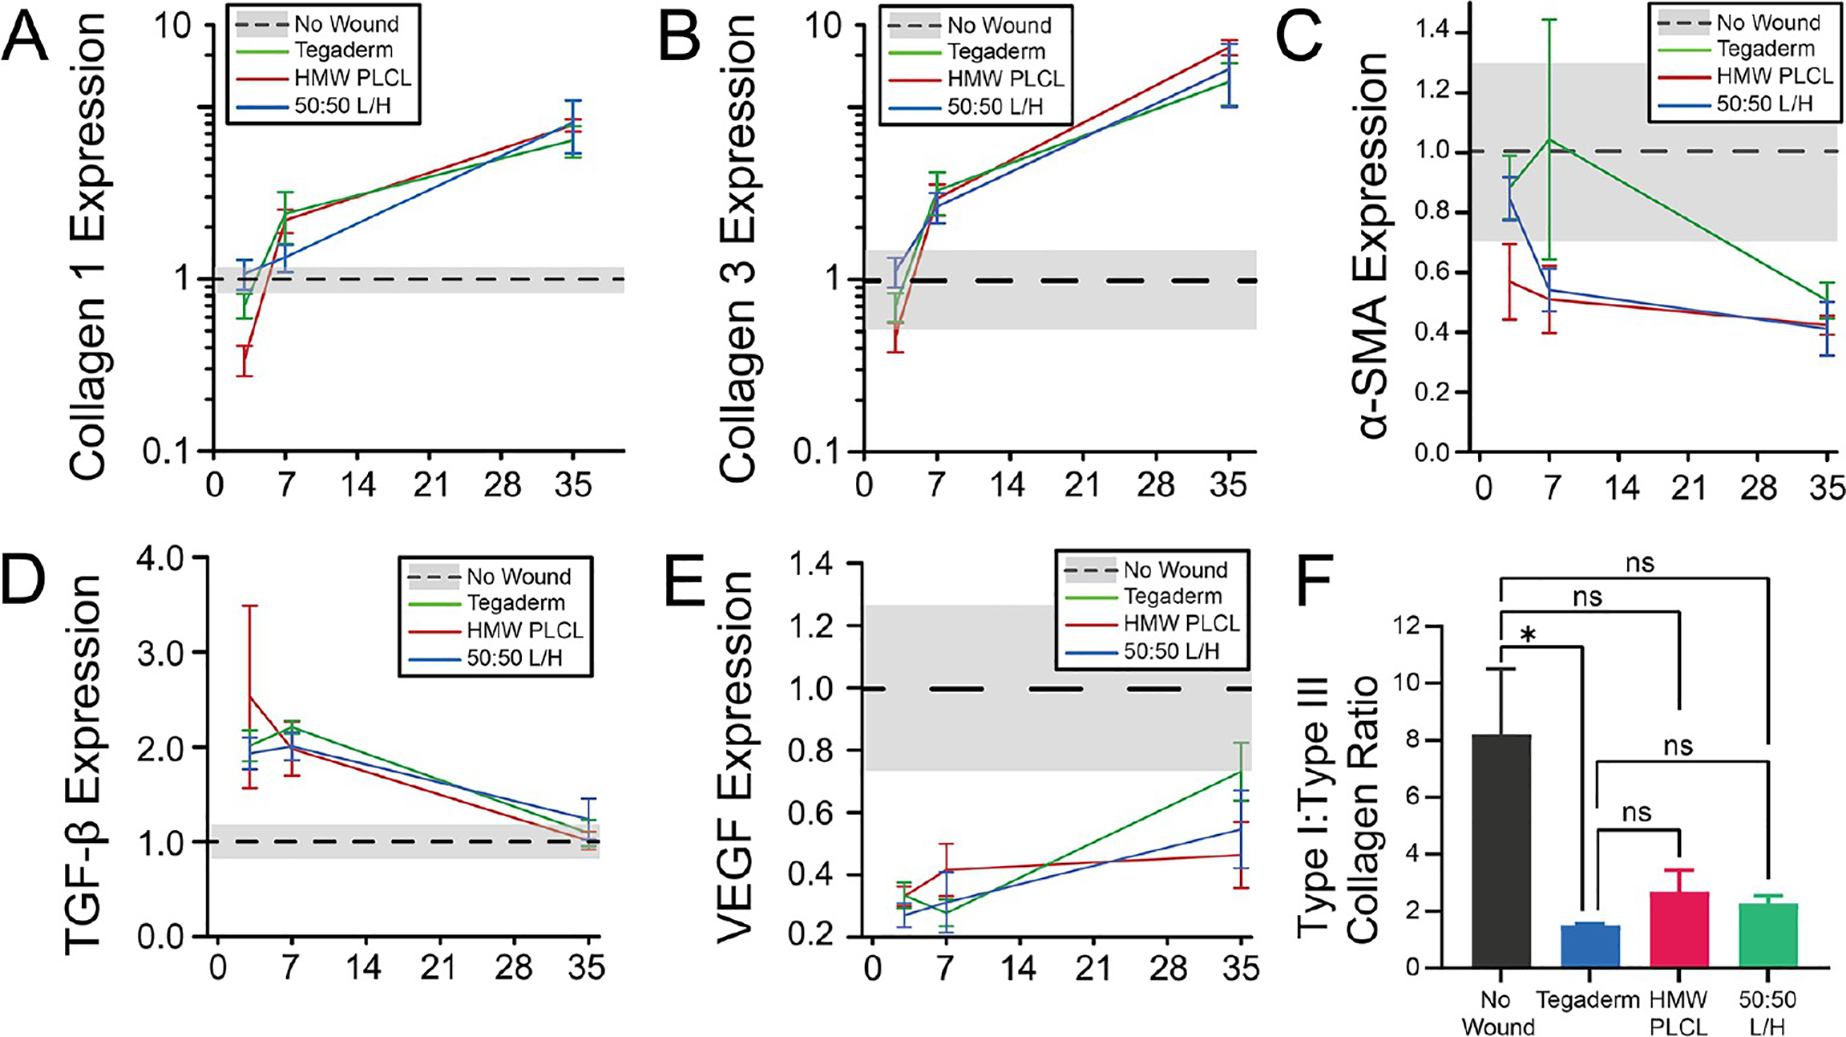
Figure 5.

RT-PCR measurements of (A) collagen I, (B) collagen III, (C) α-SMA, (D) TGF-β, and (E) VEGF. Gene expression measured relative to those of the normal uninjured (no wound) skin, which is plotted with a black dotted line and a gray band indicating standard error. (F) Collagen type I to collagen type III ratio at day 35. * P < 0.05.
