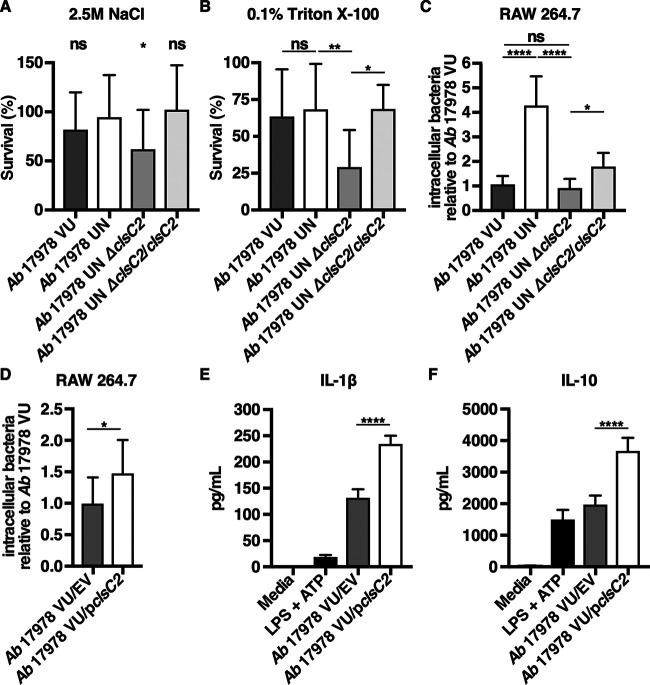
FIG 6.
The AbaAL44 clsC2 gene contributes to bacterial resistance to cell envelope stress and affects bacterial interactions with host immune cells. (A) Mid-log-phase A. baumannii 17978 VU, 17978 UN, 17978 UN ΔclsC2, or 17978 UN ΔclsC2/clsC2 variants were inoculated into LB medium supplemented with 2.5 M NaCl at a starting inoculum of 1 × 10⁷ CFU/ml, and incubated at 37°C for 2 h. After 2 h of incubation, bacterial viability was determined for each strain, and bacterial survival was calculated as the percentage of viable bacteria postincubation relative to the number of viable bacteria preincubation. (B) Mid-log-phase A. baumannii 17978 VU, 17978 UN, 17978 UN ΔclsC2, or 17978 UN ΔclsC2/clsC2 variants were inoculated into phosphate-buffered saline (PBS) supplemented with 0.1% Triton X-100 at a starting inoculum of 1 × 10¹⁰ CFU/ml and incubated at 37°C for 6 h. After incubation, bacterial viability was determined for each strain, and survival was calculated as described above. (C and D) Macrophage-like RAW 264.7 cells were infected with mid-log-phase A. baumannii 17978 VU, 17978 UN, 17978 UN ΔclsC2, 17978 UN ΔclsC2/clsC2, 17978 VU/EV, or 17978 VU/pclsC2 at an MOI of 15, and extracellular bacteria were killed with gentamicin at 30 min postinfection. Thirty minutes after the addition of gentamicin, RAW cells were washed and lysed, and intracellular bacterial burdens were determined. (E and F) Murine bone marrow-derived macrophages were infected with mid-log-phase cultures of A. baumannii 17978 VU/EV or A. baumannii 17978 VU/pclsC2 at an MOI of 10 and incubated at 37°C. At 18 h.p.i., supernatants of infected BMDMs were collected, and the concentrations of IL-1β (E) or IL-10 (F) in the supernatants of infected BMDMs were determined by ELISA. (A to D) N = 3 or 4 biological replicates per group per experiment. Graphs depict average results from at least three independent experiments. (E and F) N = 4 biological replicates per group per experiment. Graphs depict representative data. In all panels, columns depict the mean, and error bars show standard deviation of the mean. Means were compared to the mean of A. baumannii 17978 UN (A) or to all other means (B to F) using Welch’s t test (D) or one-way ANOVA adjusted for multiple comparisons (A, B, C, E and F). *, P < 0.05; **, P < 0.01; ****, P < 0.0001; ns, not significant.

