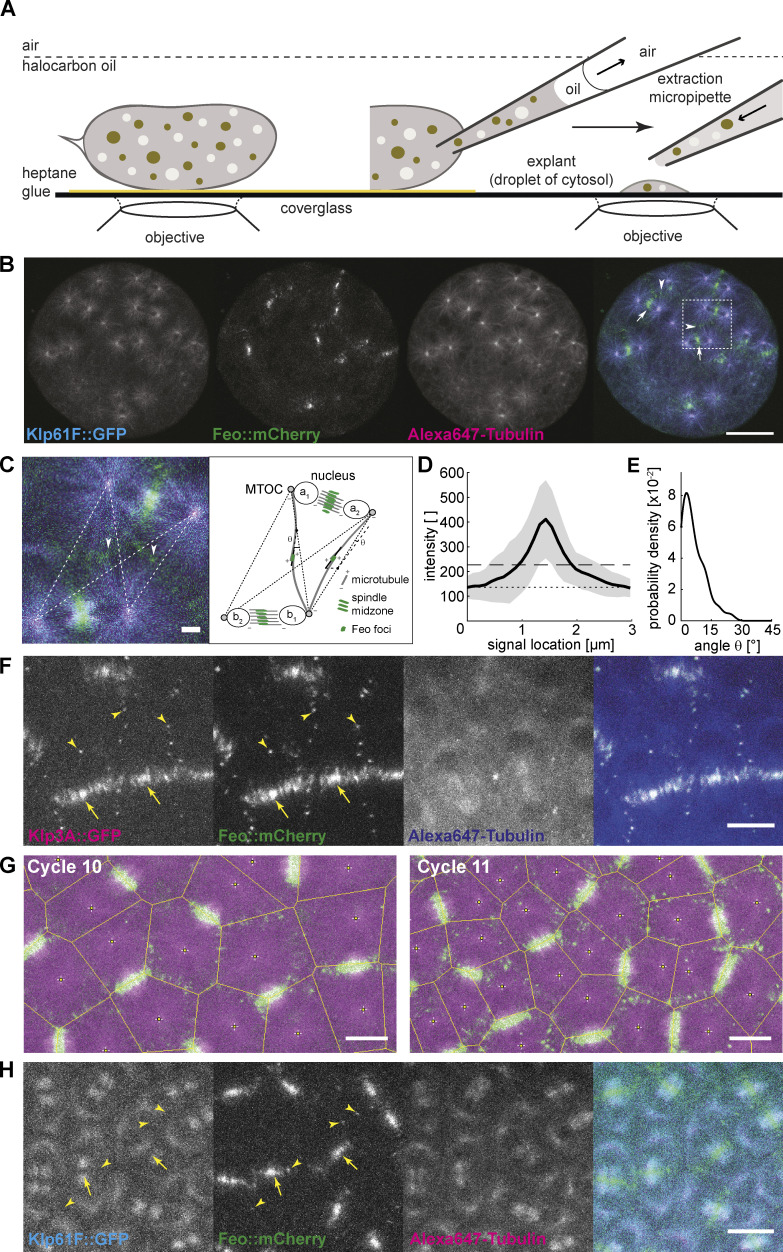
Figure 1.
Feo, Klp3A, and Klp61F localization confirm antiparallel microtubule overlaps between asters of nonsister nuclei. (A) Schematic showing a Drosophila syncytial embryo immobilized to the coverslip and covered with a thin layer of halocarbon oil ready for time-lapse microscopy. On the right, a preblastoderm embryo is punctured for extraction and deposition of cytosol on the coverslip using a micropipette, thereby generating a series of embryo explants. (B) Three-color snapshot from a time lapse (see also Video 1) of an explant generated from an embryo expressing Klp61F::GFP (cyan) and Feo::mCherry (green) and injected with Alexa Fluor 647–Tubulin (magenta). During the anaphase/telophase transition, Feo strongly localized to the spindle midzone (arrows) and to the intercalating microtubules from neighboring nuclei (arrowheads). Scale bar, 30 µm. (C) Zoom-in of the merged color channel image in B (dashed square). Feo localized as intense foci between neighboring spindles, where microtubules from nonsister nuclei meet (arrowheads show examples). The schematic on the right represents the configuration shown in the image, exemplifying the location of the two pairs of sister nuclei, a1–a2 and b1–b2, and two representative Feo foci. The dashed lines represent the shortest path of microtubule interactions between the MTOCs of nonsister nuclei. An intensity profile of the foci was generated by drawing a line (continuous) along the longest axis and centered to the foci. The angle θ relative to the dashed interaction line was determined. Scale bar, 2 µm. (D) The average intensity profile of Feo foci indicates foci length of 1.0 ± 0.35 µm. The gray area designates the SD, the dotted line marks the background level, and the dashed line marks two times SD above the background. Experimental repeats (N) = 7; n = 57. (E) The distribution of angles (θ) suggests that the antiparallel microtubule overlaps occur mostly along the connecting line between the neighboring nonsister nuclei. N = 7; n = 42. Cases where foci were symmetric and a long axis could not be determined were excluded from the analysis. (F) Three-color snapshot of a blastoderm embryo expressing Klp3A::GFP (magenta) and Feo::mCherry (green) and injected with Alexa Fluor 647–Tubulin (blue) showed that Klp3A colocalizes with Feo at the spindle midzone (arrows) and, more strikingly, as foci between neighboring nonsister nuclei (arrowheads). Scale bar, 10 µm. Refer to Video 3. (G) Two-color still images of a blastoderm embryo expressing RFP::β-tubulin (magenta) and Feo::GFP (green) during cycles 10 and 11, with Voronoi lines overlaid in yellow. The Voronoi segmentation was calculated with respect to the location of spindle poles and marks all locations with equidistant neighbors. Scale bar, 10 µm. (H) Three-color snapshot of a blastoderm embryo expressing Klp61F::GFP (cyan) and Feo::mCherry (green) and injected with Alexa Fluor 647–Tubulin (magenta) shows that Feo localized strongly between sister nuclei as part of the spindle midzone (arrows) and, unlike Klp61F, between neighboring nonsister nuclei as distinct foci (arrowheads). Scale bar, 10 µm. Refer to Video 2.

