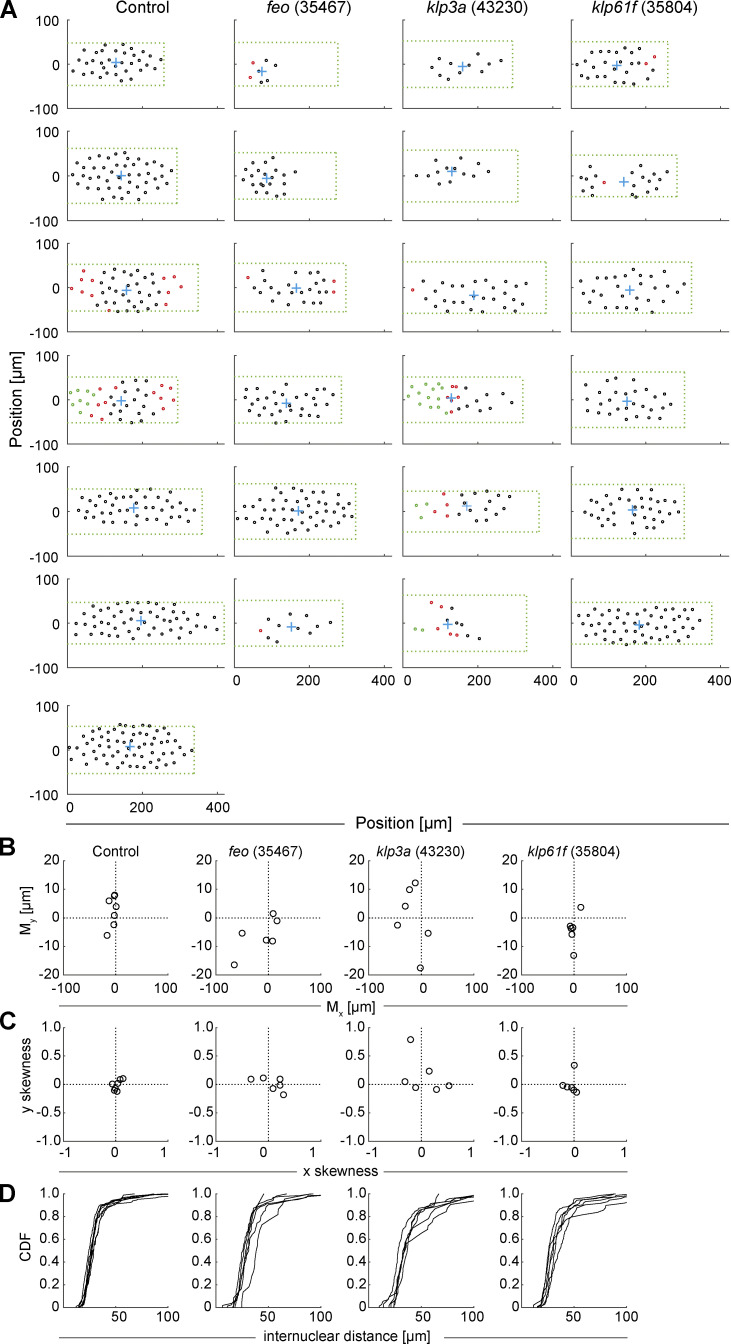
Figure S3.
Positions of nuclei in each of the analyzed embryos and distribution measurements highlight irregularity in the knockdown constructs. Related to Fig. 2. (A) The position (circle) of every nucleus arriving at the embryo cortex after the last preblastoderm division, relative to the axial and lateral borders of the embryo, for each condition: control (mCherry), Feo (35467), Klp3A (40320), and Klp61F (35804). The green dashed rectangle represents the area of the embryo bounded by the length and width of the visible embryo in the confocal stacks, with the anterior end at the coordinate origin. The blue cross represents the location of the 2D centroid determined from the position of all nuclei. The nuclei in interphase of the first division at the cortex are marked in black, the nuclei that have progressed to metaphase/anaphase are marked in magenta, and the nuclei in telophase/(next) interphase are marked in green. Note that the RNAi expression and penetration exhibit a variability, which we attribute as being responsible for the range of phenotypes. (B) Plot of the 2D centroid vector (Mx,My) of all cortical nuclei relative to the embryo center. The x axis designates the anterior-posterior axis, and the y axis is the dorsoventral axis of the embryo. Deviations from 0 mark an acentric delivery of nuclei to the cortex. (C) Skewness plot of the positional distribution of all nuclei along the anterior-posterior (x) and dorsoventral (y) axes. Feo RNAi and Klp3A RNAi embryos showed asymmetric nuclear distribution, while nuclei in Klp61F RNAi embryos were distributed symmetrically. (D) Cumulative distribution plot of the first-order neighbor distance between nuclei. All RNAi lines showed higher variability in internuclear distance as compared with the control. CDF, cumulative distribution function.

