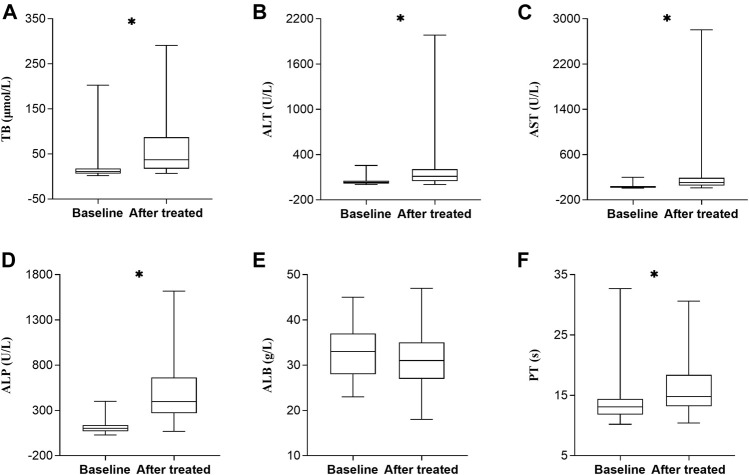
FIGURE 2.
Changes of laboratory test values before and after tigecycline treatment in DILI patients (n = 55). Horizontal bars represent the median value, boxes represent the interquartile range and whiskers indicate the minimum and maximum value. Wilcoxon’s test was used to compared baseline and after tigecycline treatment’s biochemical test values. *p < 0.0001. Abbreviation: TB, total bilirubin; ALT, alanine aminotransferase; AST, aspartate aminotransferase; ALP, alkaline phosphatase; ALB, albumin; PT, prothrombin time; DILI, drug-induced liver injury.

