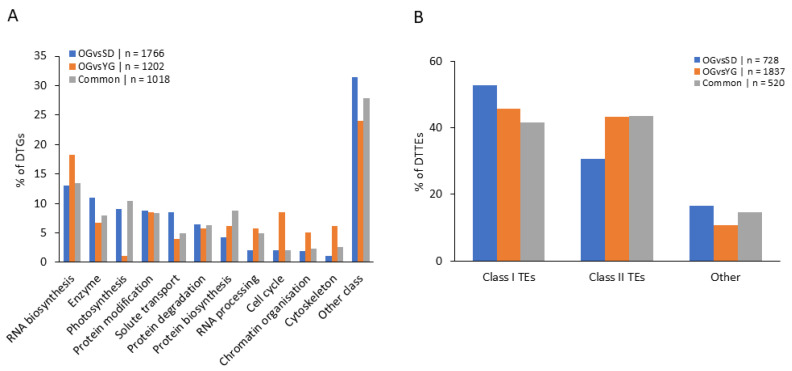
Figure 3.
Classification of differentially expressed transcripts. (A) Percentage of DTGs in each comparison in function of the gene classification according to Lohse et al. [64]. (B) Percentage of DTTEs in each comparison in function of TEs classification according to Daccord et al. [65]. Classes represented by less than 5% in the three conditions were summed up in “Other class”. Transposon in “other” class correspond to potential host gene and unclassified TEs according to Daccord et al. [65].

