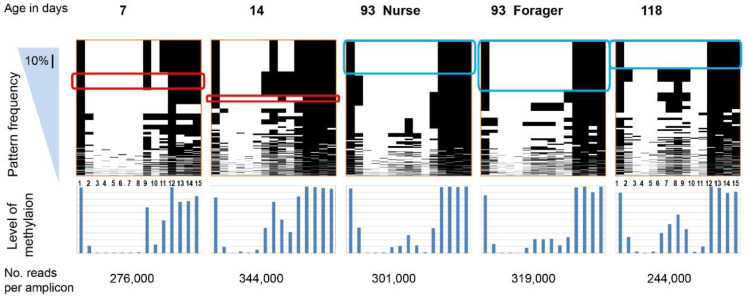
Figure 1.
All methylation patterns for 15 CpG sites in the nadrin amplicon revealed by Illumina MiSeq; “Frequency” denotes the pattern sorting direction (i.e., most frequent patterns at the top). The scale bar in the blue triangle corresponds to 10% of all patterns. The lower panel shows the combined methylation level for each CpG. The rounded red and blue rectangles indicate selected identical patterns between two or three situations. The age of the bees used is shown above the top panel (see Table 2 for a full description of the biological material). For details on the nadrin gene structure and amplicon localisation, see Figure S1 and Table 1. The number of reads per amplicon is indicated at the bottom.

