
FIG. 3.
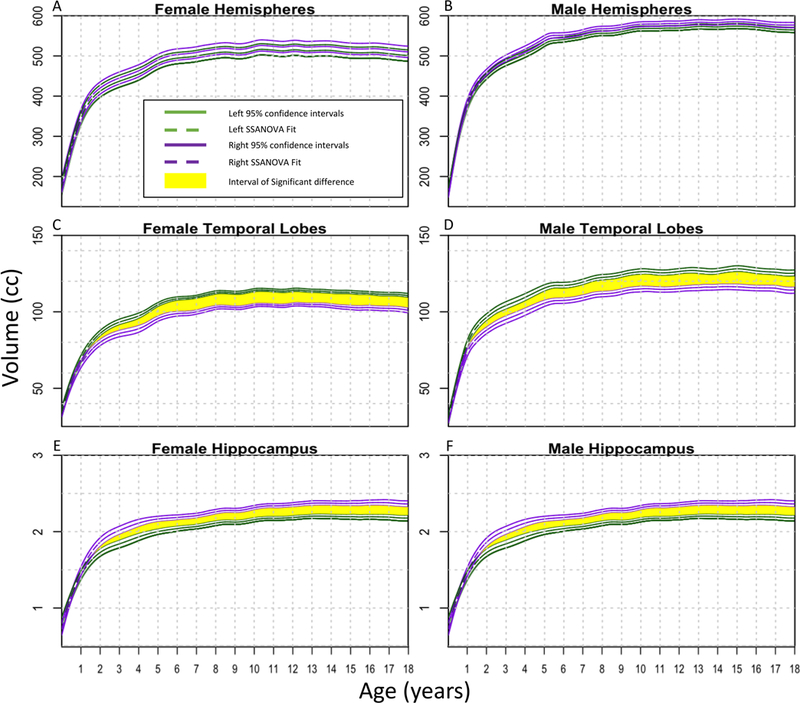
SSANOVA models with random effects were fit to hemispheres (A and B), temporal lobes (C and D), and hippocampi (E and F). For each plot, the left side is represented by green and the right side by purple. The dashed line represents the fit, with the two solid lines on either side showing the Bayesian 95% confidence intervals. The upper and lower intervals for the right and left sides overlap throughout the entire time frame for the hemispheres; therefore, there are no statistically significant differences. For the temporal lobes and hemispheres, time periods of significant differences at which the intervals do not overlap are shown in yellow.