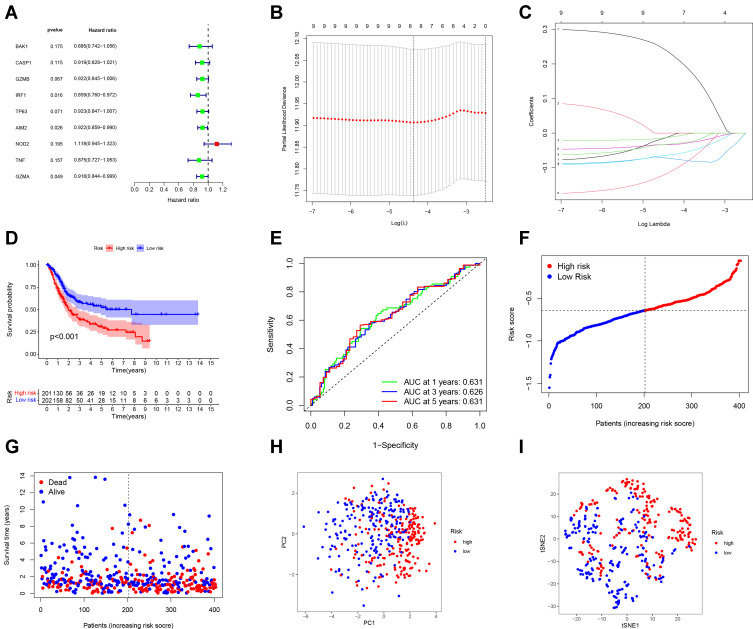
Figure 3.
Construction of risk signature in the TCGA cohort. (A) Univariate cox regression analysis of OS for selected pyroptosis-related gene with P < 0.2. (B) LASSO regression of the 9 OS-related genes. (C) Cross-validation for tuning the parameter selection in the LASSO regression. (D) Kaplan–Meier OS curves of patients in the high- and low-risk groups. (E) ROC curves demonstrated the predictive efficiency of the risk score. (F) Distribution of patients based on the risk score. (G) The survival status for each patient. (H) PCA plot for BCs based on the risk score. (I) t-SNE plot for BCs based on the risk score.

