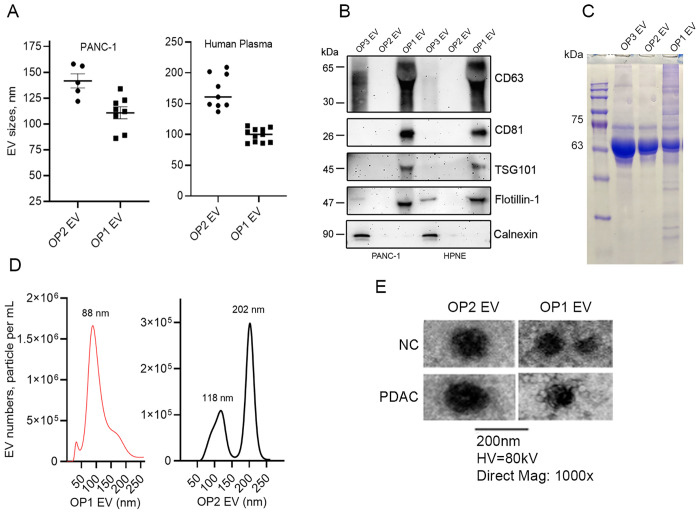
Fig 2. Characterization of EVs by nanoparticle tracking analysis, exosome marker detection, and electron microscopic examination.
A. Nanoparticle tracking analysis of OP1and OP2 EVs derived from PANC-1 cells and healthy donor human plasma. B. Western blot analysis of CD63, CD81, TSG101, flotillin-1, and calnexin in the OP1, OP2, and OP3 EVs derived from PANC-1 cells (40μg protein each lane, non-reducing condition for CD63, n = 3). C. Coomassie blue staining of the SDS-PAGE gel loaded with proteins from OP1, OP2 and OP3 EVs (25μg each lane). D. Representative nanoparticle tracking analysis of OP1 and OP2 EV concentrations (PANC-1). E. Representative electronic microscopic images of OP1 and OP2 EVs (Human plasma).

