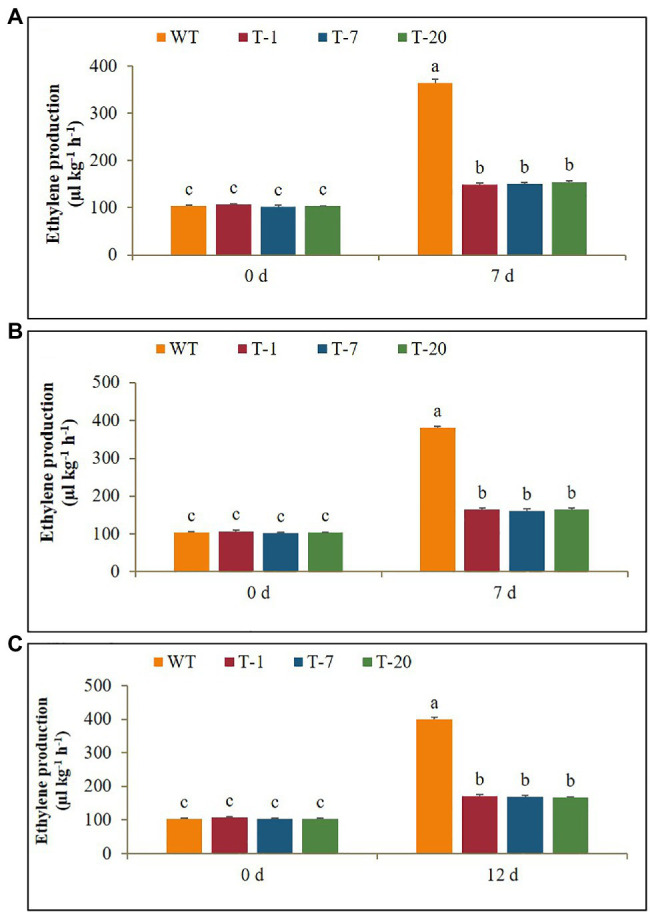
Figure 10.

Comparison of ethylene production in wild type (WT) and transgenic petunia cv. ‘Mirage Rose’ exposed to cold stress (A) and drought stress (B) for 0 and 7days, and salt stress (C) for 0 and 12days. Data represent the means of three replicates, and error bars indicate standard error. Means with the same letters are not significantly different by DMRT (p<0.05).
