
Figure 9.
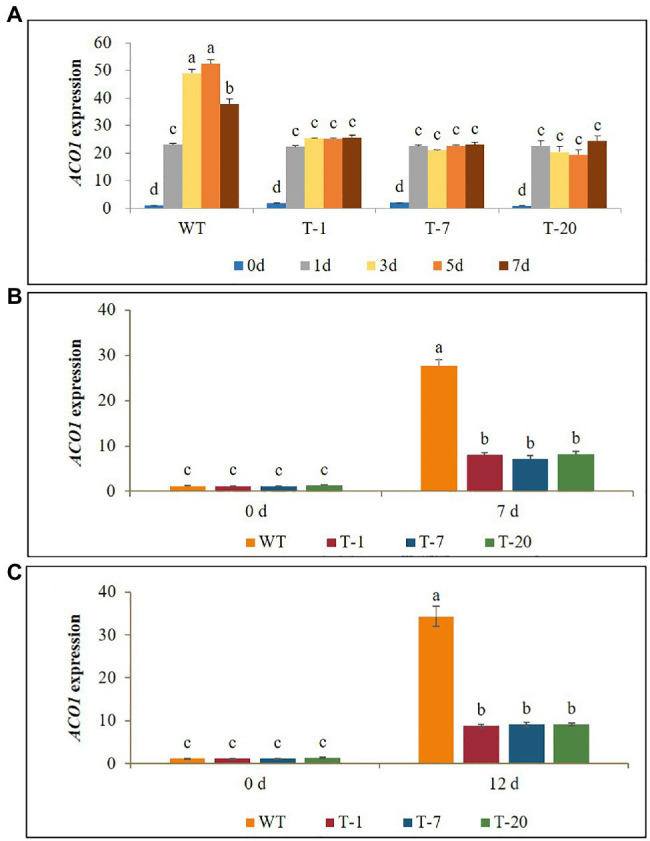
Illustration of transcript levels of ethylene biosynthesis gene ACO1 expressed in wild type (WT) and transgenic petunia cv. ‘Mirage Rose’ exposed to cold stress for 0, 1, 3, 5, and 7days (A), drought stress for 0 and 7days (B), and salt stress (C) for 0 and 12days. Data represent the means of three replicates, and error bars indicate standard error. Means with the same letters are not significantly different by DMRT (p<0.05).