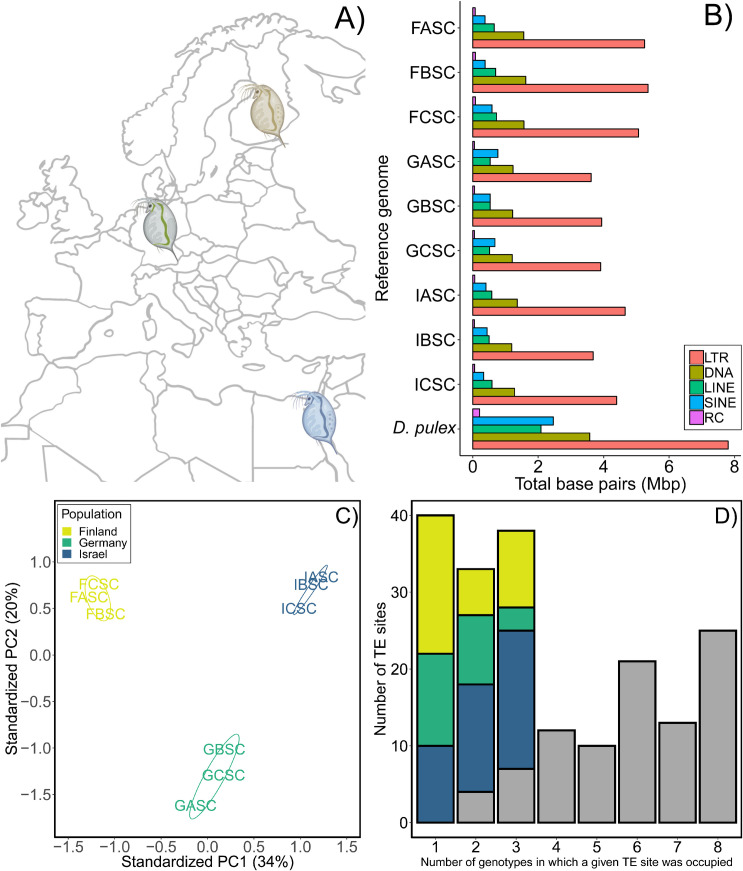
Fig 2. TE profiles for the 9 starting genotypes of Daphnia magna.
(A) Map of the three populations (Finland [FASC, FBSC, FCSC], Germany [GASC, GBSC, GCSC], and Israel [IASC, IBSC, ICSC]) from which genotypes were collected (created with BioRender.com). (B) Abundance and diversity (in millions of bp [Mbp]) per type of TE (Long Terminal Repeats [LTR], DNA transposons [DNA], Long Interspersed Nuclear Elements [LINE], Short Interspersed Nuclear Elements [SINE], and Rolling Circle elements [RC]) compared to D. pulex (reference genome; PA42 [BioProject: PRJEB14656]). (C) Principal Component Analysis based on TE insertion polymorphism (TIP) data distinguishes populations based on the presence/absence of TEs (n = 192 polymorphic sites). (D) Number of polymorphic TE sites occupied; the left bar (x = 1) is the number of singletons (sites occupied in only one genotype), colored portions of bars in x = 2 and x = 3 represent sites occupied in 2 and 3 genotypes, respectively, when from the same population. Grey portions of each bar represent the number of sites that were occupied in ≥2 genotypes that were not population-specific. FASC was used as the reference assembly for (C) and (D); see S2 Text.

