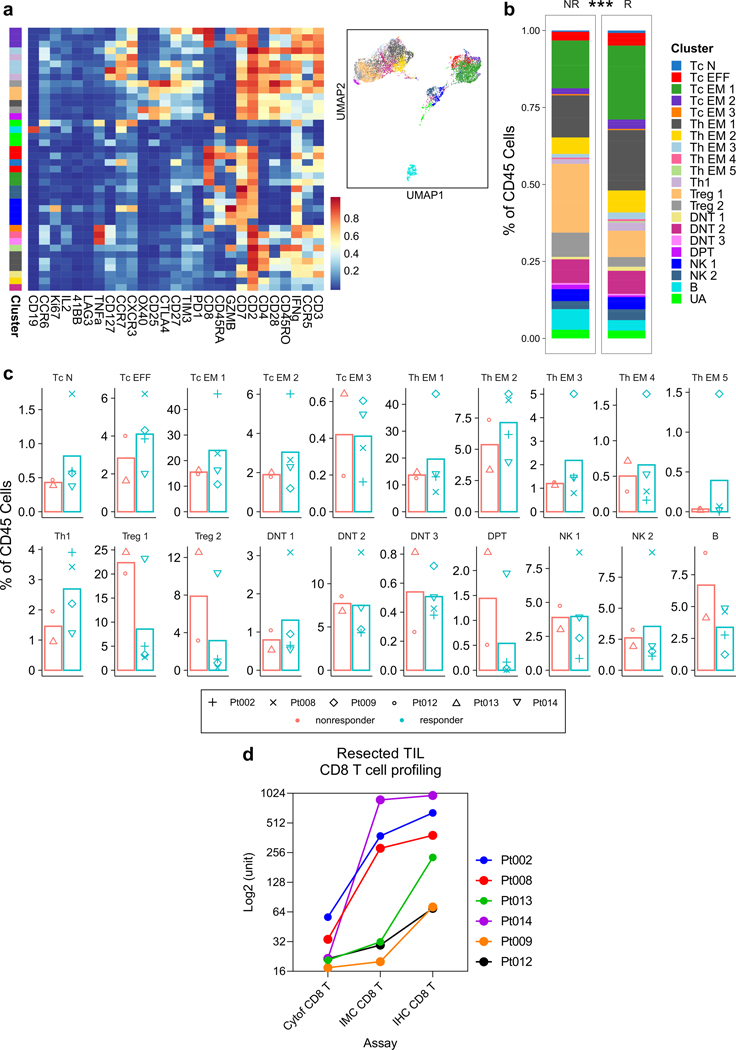
Extended Data Fig. 6. Combination of cabozantinib and nivolumab promotes local T cell responses.
a, Six post-treatment surgical samples were enzymatically dissociated into single-cell tumor infiltrating leukocytes and were assayed by a 27-marker CyTOF panel dedicated to phenotyping T cells. FlowSOM algorithm was employed to generate 40 metaclusters which were annotated into 21 final clusters. Scaled expression profile for each of the clusters are shown in the heatmap and UMAP. b, Stacked bar plots show immune cell subtype distribution at the single cell level for non-responder (NR, n=79939 cells) and responder (R, n=25086 cells) samples. ***P<2.2e-16 (Chi-squared). c, Abundance of each subtype as a percentage of CD45 cells for each patient sample. Abbreviations: DNT, double-negative T; DPT, double-positive T; EFF, effector; EM, effector memory; EX, exhaustion marker positive; N, naïve; NK, natural killer; UA, unassigned. d, Comparison of CD8 T cell quantification by CyTOF, IMC, and IHC.

