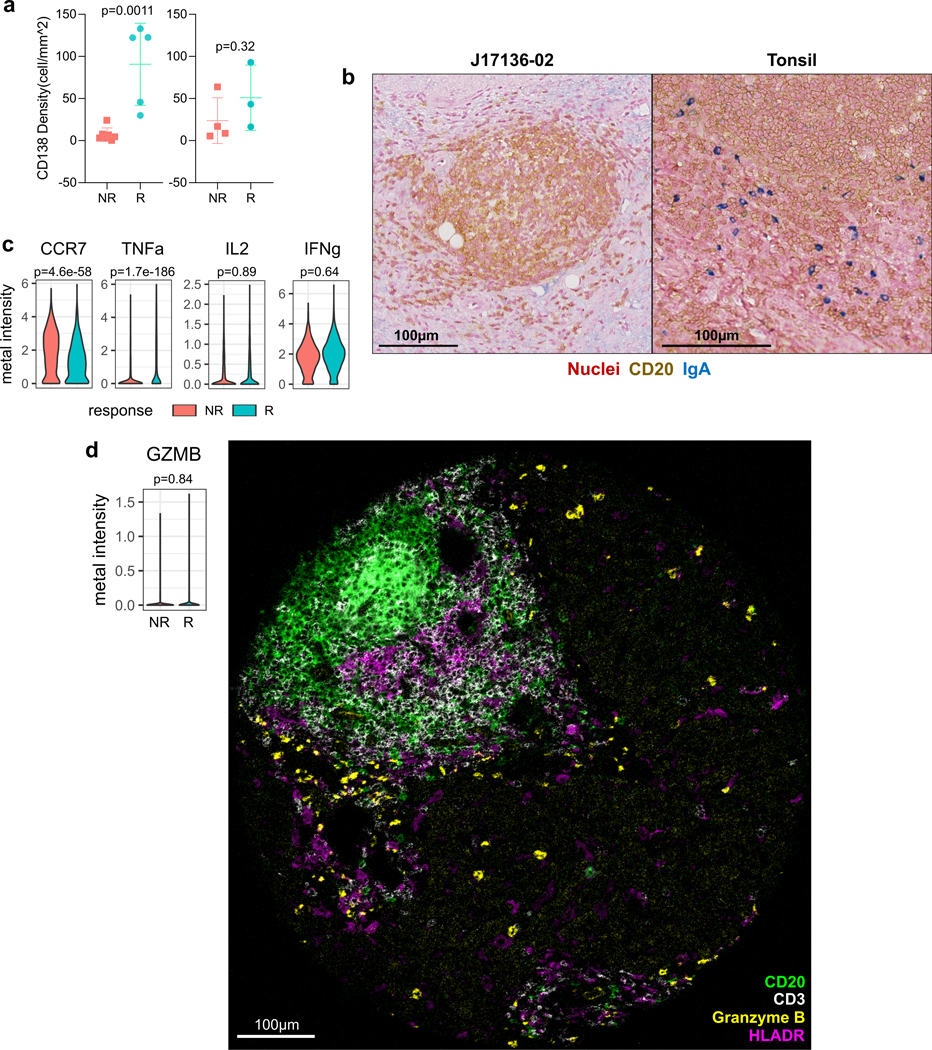
Extended Data Fig. 9. B cells indirectly contribute to antitumor immune response.
a, Results from immunohistochemistry of CD138 in nonresponders (NR) and responders (R) for tumor regions (left; NR, n=7; R, n=5 patients) and non-tumor regions (right; NR, n=4; R, n=5). Data represented as mean±s.d.; P values based on unpaired two-tailed t-test. b, Representative dual CD20-IgA staining result of a responder patient (left) and a positive control tonsil tissue (right). Image selected from one of five responder patient. c, Violin plots of per-cell metal intensities for CCR7, TNFα, IL2, and IFNγ in NR vs. R samples measured by CyTOF (NR, n=2789 cells; R, n=1593 cells). Indicated are FDR-adjusted P values (linear modeling). d, Violin plot (left) of per-cell granzyme B (GZMB) metal intensity in NR (n=2789 cells) vs. R (n=1593 cells). FDR-adjusted P value (linear modeling). Representative multicolored image of IMC in a responder core exhibiting a tertiary lymphoid aggregate with a prominent focus of B cells along with CD3, HLADR, and granzyme B expression. Image selected from one of 15 responder cores.

