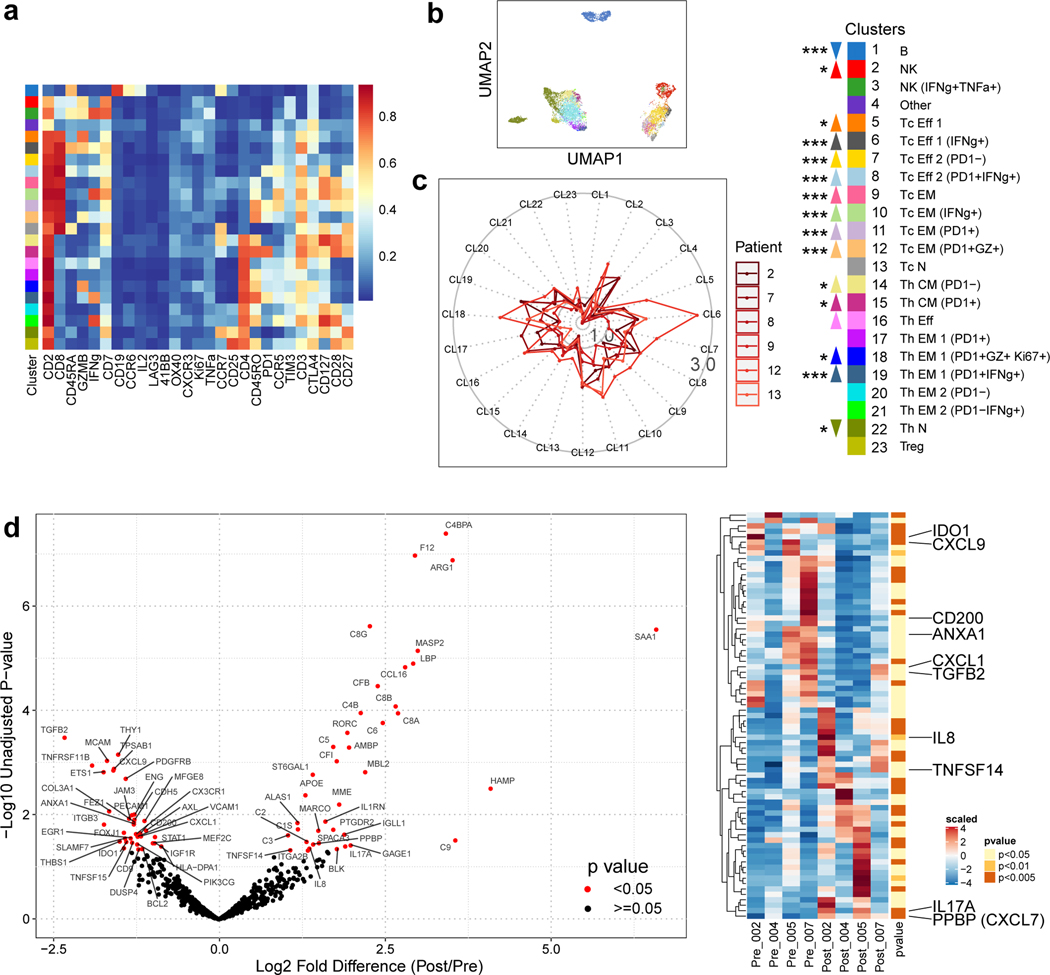
Figure 2.
Cabozantinib enhances systemic and local antitumor T cell responses. a, Serially obtained peripheral blood mononuclear cells (PBMCs) from six paired pre- and post-cabozantinib (cabo) samples were assayed by a 27-marker CyTOF panel dedicated to phenotyping T cells. FlowSOM algorithm as employed to generate 23 annotated final clusters. Scaled expression profile for each of the clusters identified from the entire dataset and hierarchically clustered are shown in the heatmap. b, UMAP representation of the annotated clusters. c, Radar plots showing post-cabo versus baseline fold changes for each patient. Inner solid boundary, 1-fold difference; outer solid boundary, 3-fold difference. Color legends are shared by panels A-C. Upward or downward arrows reflect direction of change due to cabo (***, P<0.005; **, P<0.01; *, P<0.05; FDR-adjusted, paired modeling by patient, edgeR). d, Volcano plots showing the results of nCounter® PanCancer Immune Profiling Panel for four paired pre- and post-cabo samples extracted from FFPE core biopsies. Red, unadjusted P-value <0.05 by linear modeling. Adjacent heatmap shows scaled levels of markers in each sample. Unadjusted p-values are annotated by color. Abbreviations: CM, central memory; Eff, effector; EM, effector memory; N, naïve; NK, natural killer; Tc, cytotoxic T; Th, helper T.

