Figure 4.
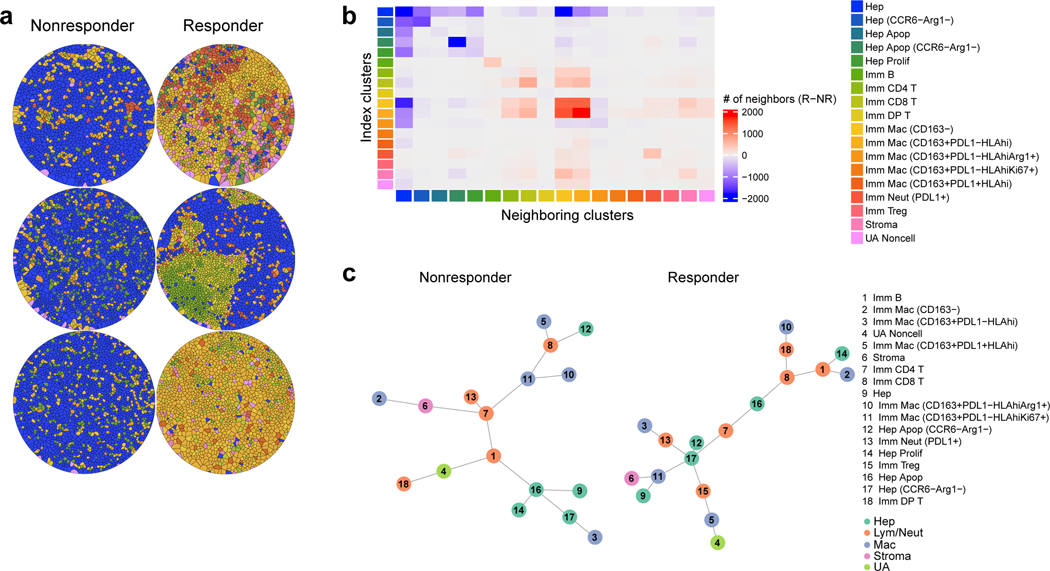
Spatial relationships among the cell types are distinct with respect to response. a, Representative Voronoi tessellations of three cores for each response group (each core is from a unique patient; representative of n=6 patients). b, Heatmap displaying top neighboring cell types (columns) for each given index cell type (rows). The difference between responder and non-responder cells in their absolute number of top two neighboring cell types are indicated by color (red, more in responders; blue, more in non-responders). Cell type clusters are annotated by color along the rows and columns Color legends apply to panels A and C (data representative of n=12 patients total). c, Minimum spanning tree representations of spatial relationships among the cell types in the non-responder (n=37196 cells) and responder (n=22257 cells) groups based on minimum Euclidean distances from each cell to all other cell types. Abbreviations: Apop, apoptotic; DP, double-positive; Hep, Hepatocellular carcinoma; Imm, immune subtype; Lym, lymphocyte; Mac, macrophage; Neut, neutrophil; NR, non-responder; R, responder; Tc, cytotoxic T; Th, helper T; UA, unassigned.

