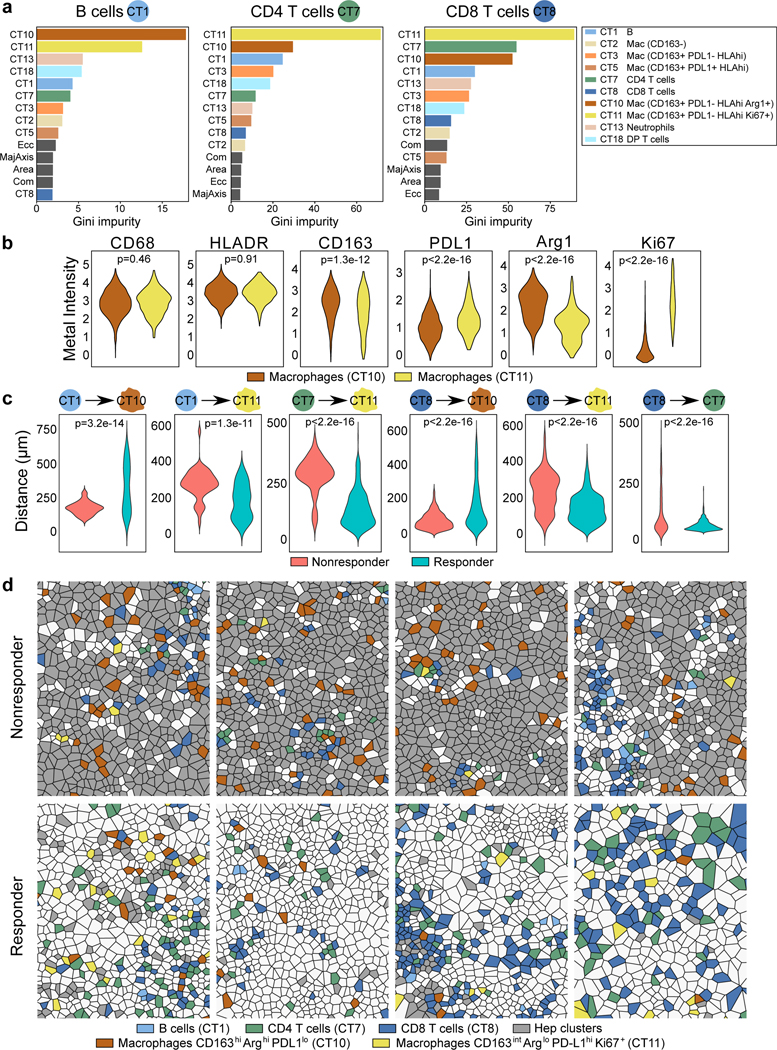
Figure 5.
Proximity between lymphoid and macrophage subtypes are key determinants of response to cabozantinib and nivolumab. a, Results from random forest algorithm evaluating minimum Euclidean distances among immune cell types shown as Gini impurity statistics. Distances to all other immune cell types from B cells (“CT1”, left box), CD4+ T cells (“CT7”, middle box), and CD8+ T cells (“CT8”, right box) are ranked by order of importance in response prediction. Data for panels a-c are representative of all evaluable n=12 patients.b, Metal intensities of functional markers for the two macrophage subtypes (indicated are FDR-adjusted P values, linear modeling) n=1452 CT10 vs. 359 CT11. c, Most important minimum Euclidean distances from each index cell type (B, CD4+ T, or CD8+ T; shown as the circle on the left) to other cell types are shown at the per-cell level as violin plots (indicated are FDR-adjusted P values, linear modeling). R vs. NR: n=73 vs. 103 B cells, n=349 vs. 172 CD4+ T cells, n=598 vs. 401 CD8+ T cells. d, Voronoi diagrams visualizing spatial relationships among B cells, CD4+ T cells, CD8+ T cells, and the two macrophage subtypes for non-responders and responders (represents four unique patient samples for each group). Hep clusters are depicted in grey. Abbreviations: Com, compactness; DP, double-positive; Ecc, eccentricity; Mac, macrophage; MajAxis, major axis diameter.

