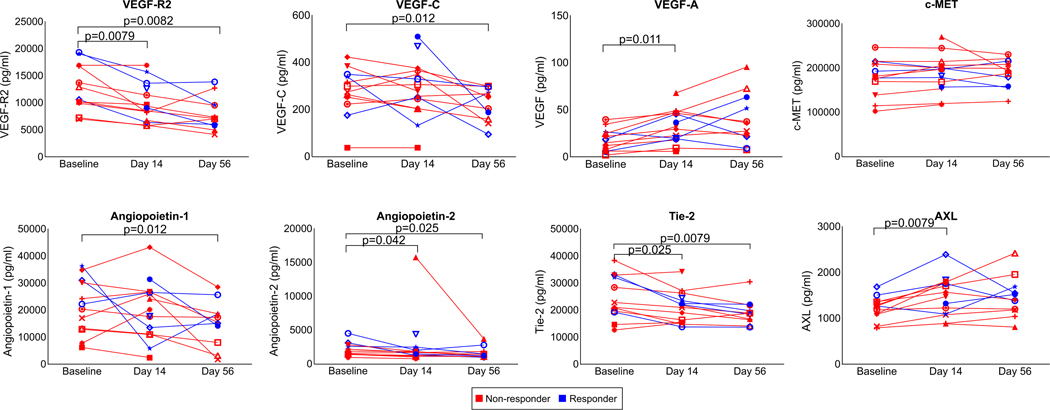
Extended Data Fig. 1. Cabozantinib induces changes in plasma correlates.
Concentrations (pg/ml) of VEGF-R2, VEGF-C, VEGF-A, c-MET, Angiopoietin-1, Angiopoietin-2, Tie-2, and AXL in longitudinally obtained plasma samples are shown as line graphs. AXL and c-MET are measured by ELISA assays. All other correlates were measured by Luminex multiplex assays. Data representative of two technical replicates. Each line represents an individual patient. Red and blue lines reflect pathologic non-responders and responders, respectively. Indicated are significant FDR-adjusted P values (<0.05, paired two-tailed t-tests).

