
Extended Data Fig. 7 |. Compound effect in subcutaneous MV4–11 and SKM-1 xenograft models.
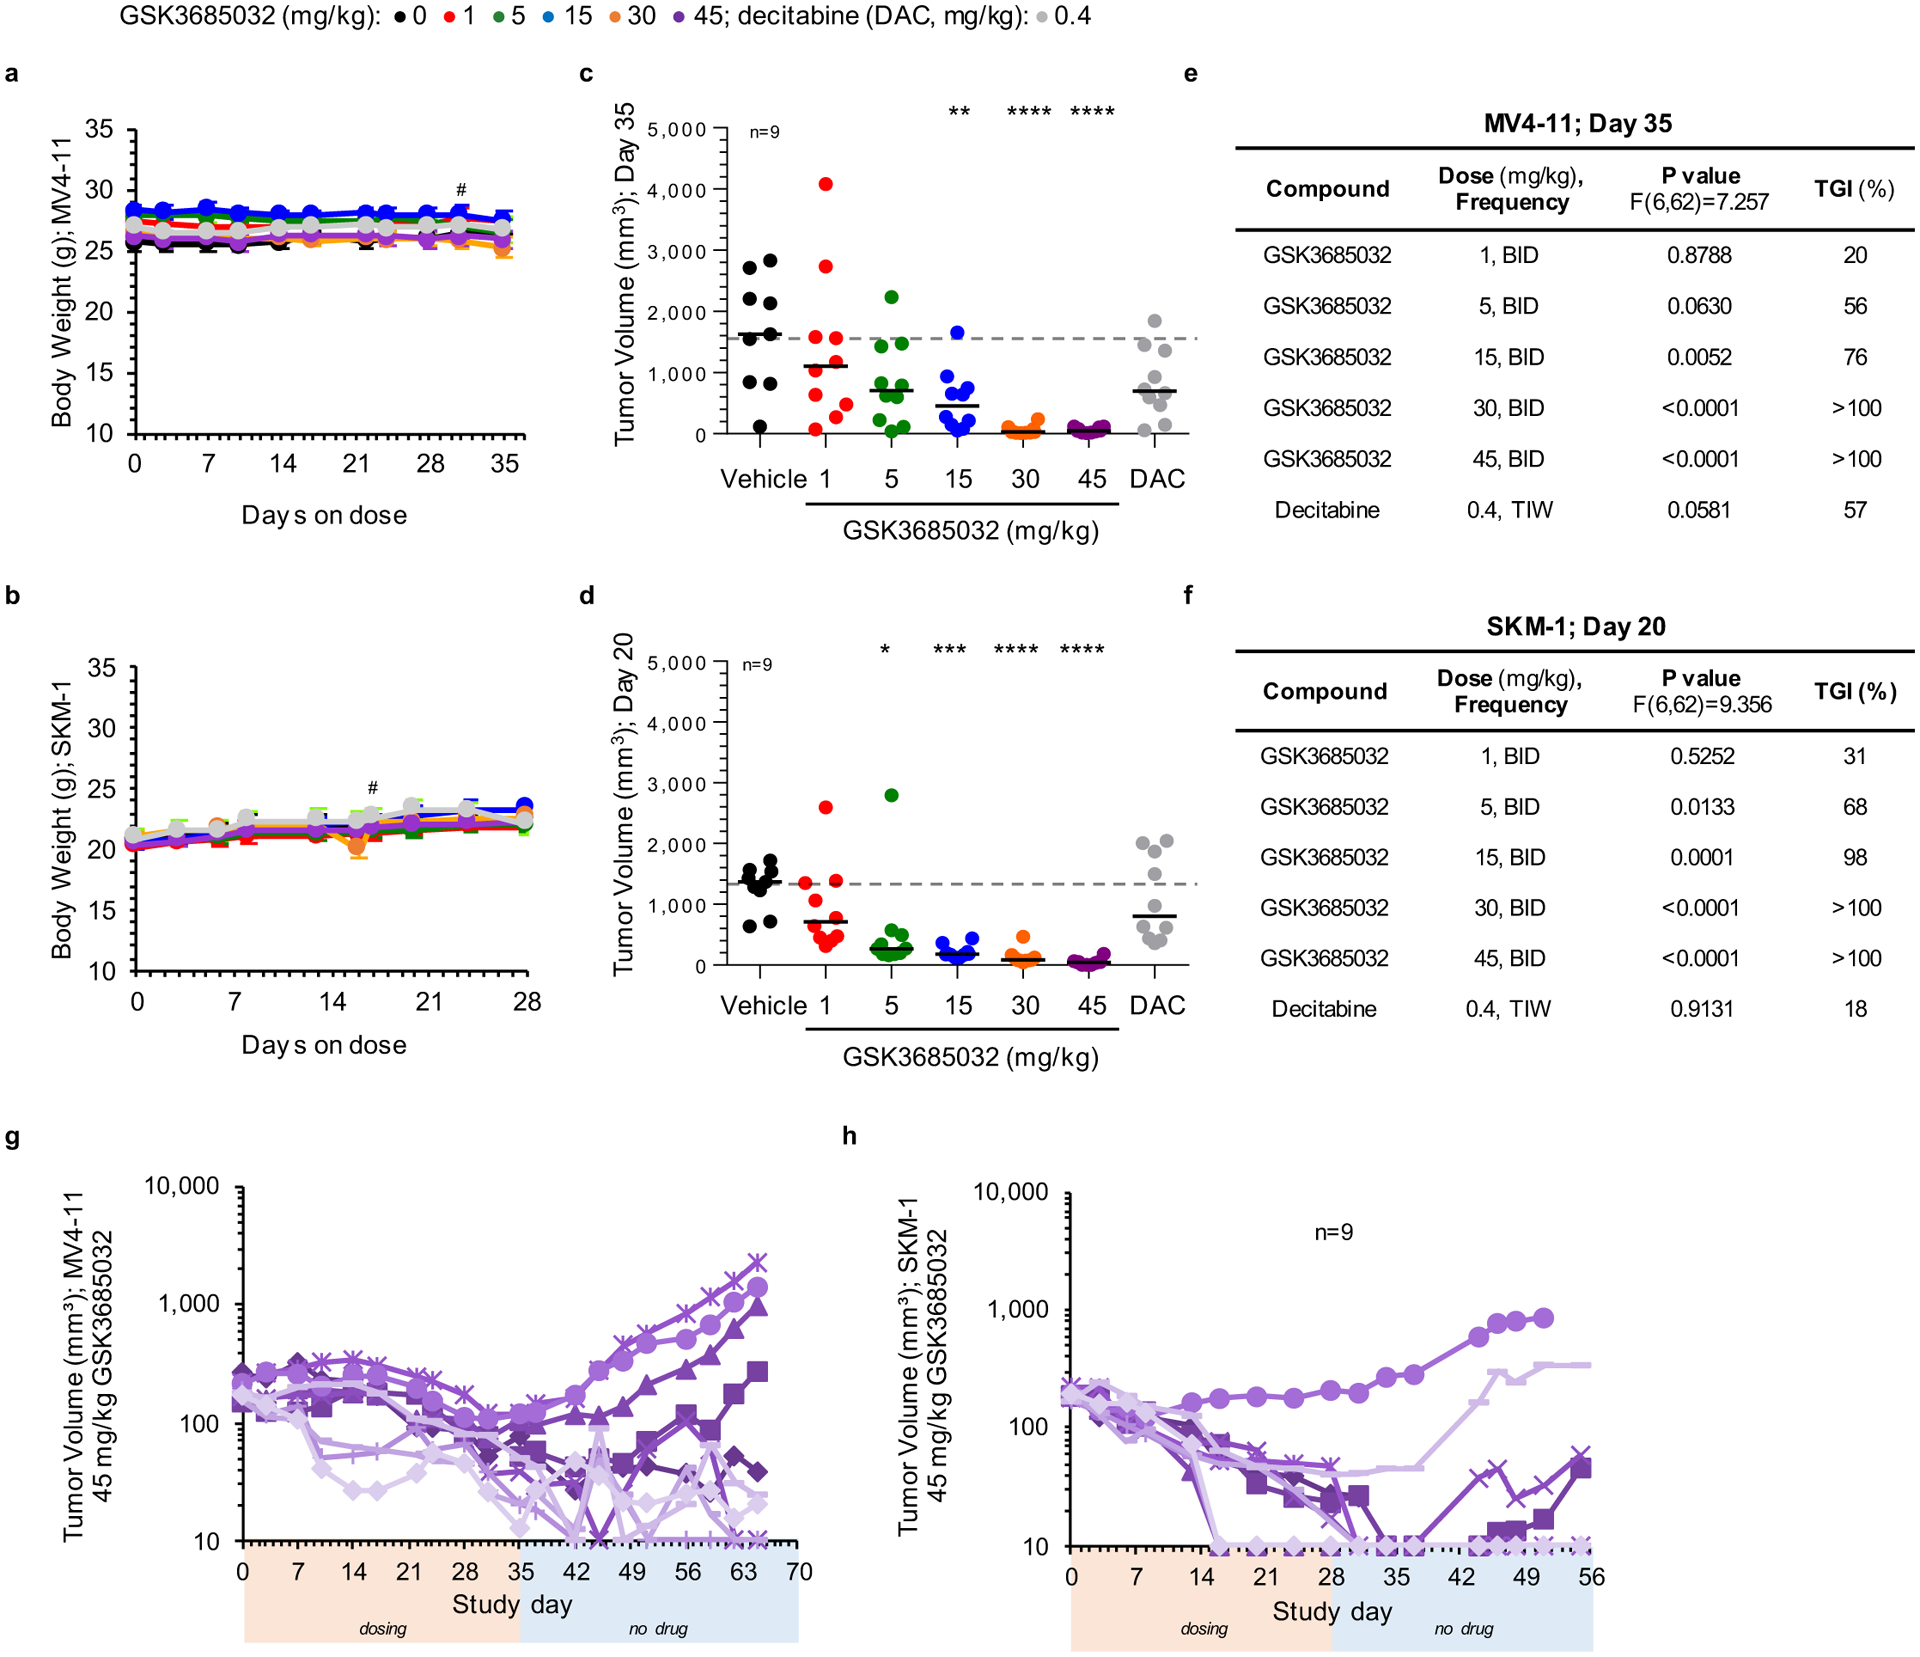
a, b, Animal body weight measurements for MV4–11 (a) or SKM-1 (b) xenograft models spanning the dosing duration of the study (average ± s.d.; n = 10 animals/group, # represents day first animal came off study due to tumor volume). c-f, Individual tumor volume measurements for MV4–11 (c, day 35) or SKM-1 (d, day 20). Solid line represents the median for each group (n = 10 animals unless noted). Dotted line represents the median tumor volume for vehicle. Statistical significance* of treatment versus vehicle was calculated using one-way ANOVA, Dunnett’s multiple comparisons test. Table summarizes adjusted P values to account for multiple comparisons and corresponding tumor growth inhibition (TGI) values for each group within the MV4–11 (e) or SKM-1 (f) xenograft models. g, h, Individual tumor volume measurements for the 45 mg/kg GSK3685032 group in MV4–11 (g) or SKM-1 (h) xenograft models during the dosing segment (orange bar) and continuing for ≥ 27 days off drug (blue bar) to monitor durability (n = 10 animals unless noted). The minimum measurable tumor volume was set to 10 mm3.