
Fig. 3 |. Phenotypic response following treatment with DNMT inhibitors in hematologic cancer cell lines.
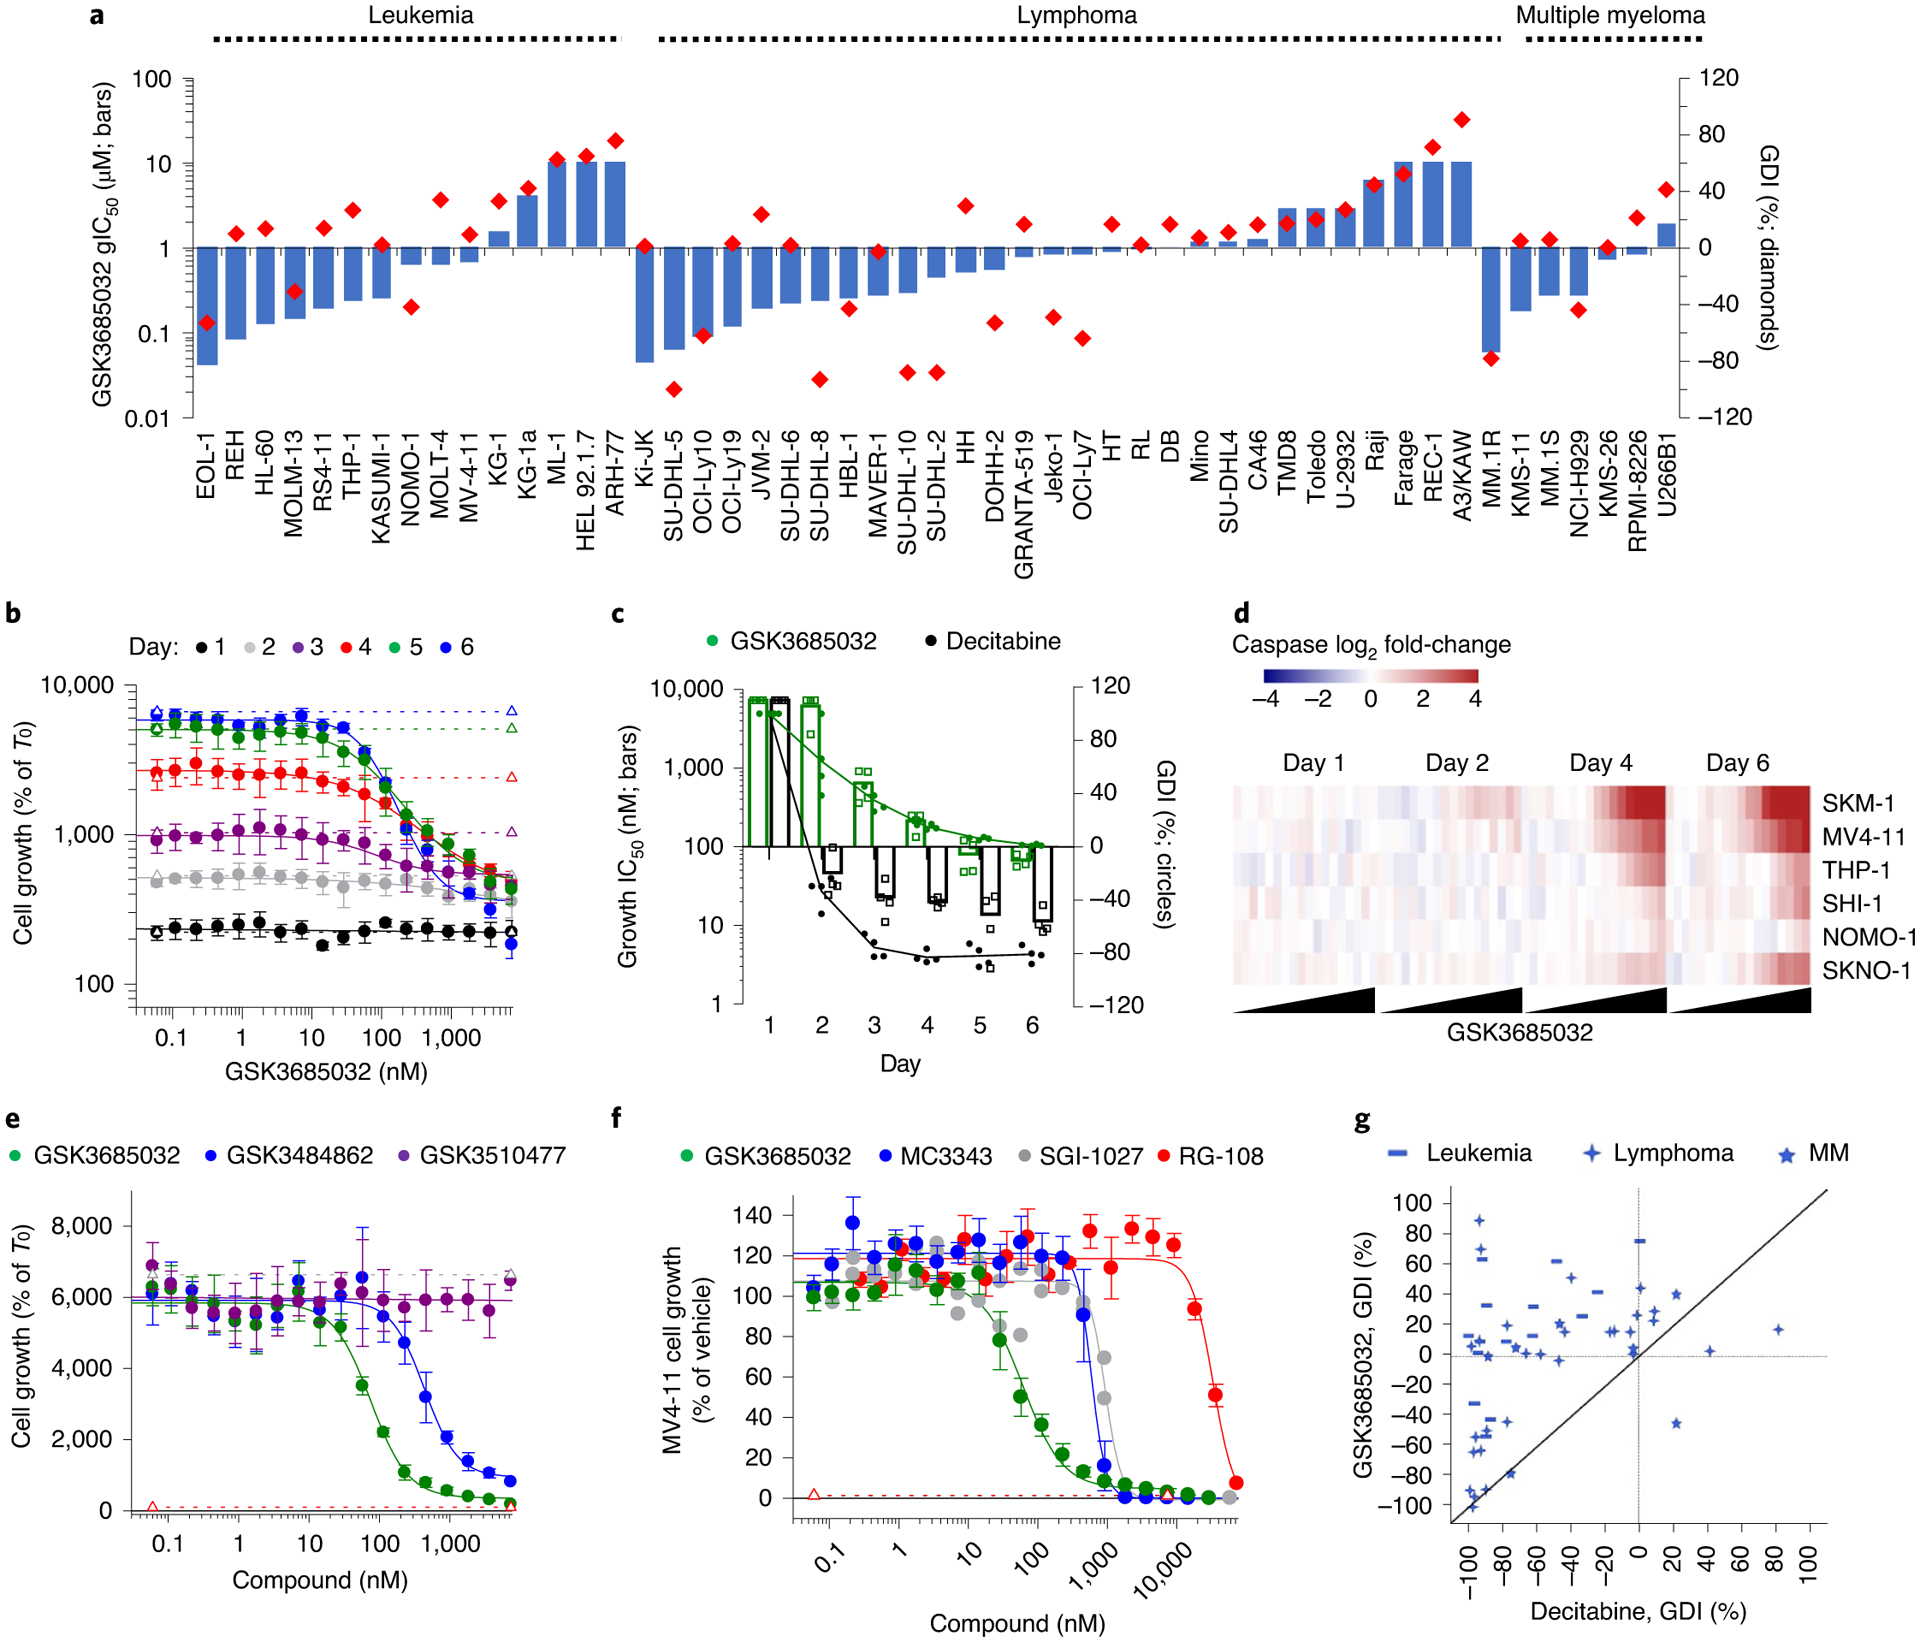
a, GSK3685032 gIC50 and GDI values in a 6-d proliferation assay for 51 hematologic cell lines. b, Proliferation dose–response curves for MV4–11 cells treated with GSK3685032 spanning days 1–6 (n = 4 biologically independent experiments; average ± s.d.). Dotted lines represent cell growth of the vehicle control for each day. c, Potency (gIC50) and GDI values for MV4–11 cells treated with GSK3685032 or DAC over time (n = 4 biologically independent experiments; mean). d, Heatmap showing induction of caspase-glo 3/7 activity (Promega, log2; average of n = 2 biologically independent experiments) in a panel of AML cell lines following treatment with GSK3685032 (0.06–7,340 nM). e, Day 6 MV4–11 proliferation dose–response curves (n = 4 biologically independent experiments; average ± s.d.) for GSK3510477, GSK3484862 and GSK3685032. Dotted line represents starting cell number (T0) or vehicle growth (T6). f, MV4–11 proliferation dose–response curves at day 6 treated with a panel of DNMT inhibitors (GSK3685032 n = 7, MC3343 n = 6, SGI-1027 n = 2, RG-108 n = 3; n = biologically independent experiments; if n > 3, shown as average ± s.e.m.). Dotted line represents starting cell number (T0). g, Correlation plot of the day 6 GDI values (%) in 51 hematologic cell lines following treatment. MM, multiple myeloma.