
Fig. 4 |. GSK3685032 induces changes in DNA methylation and gene expression in treated cells.
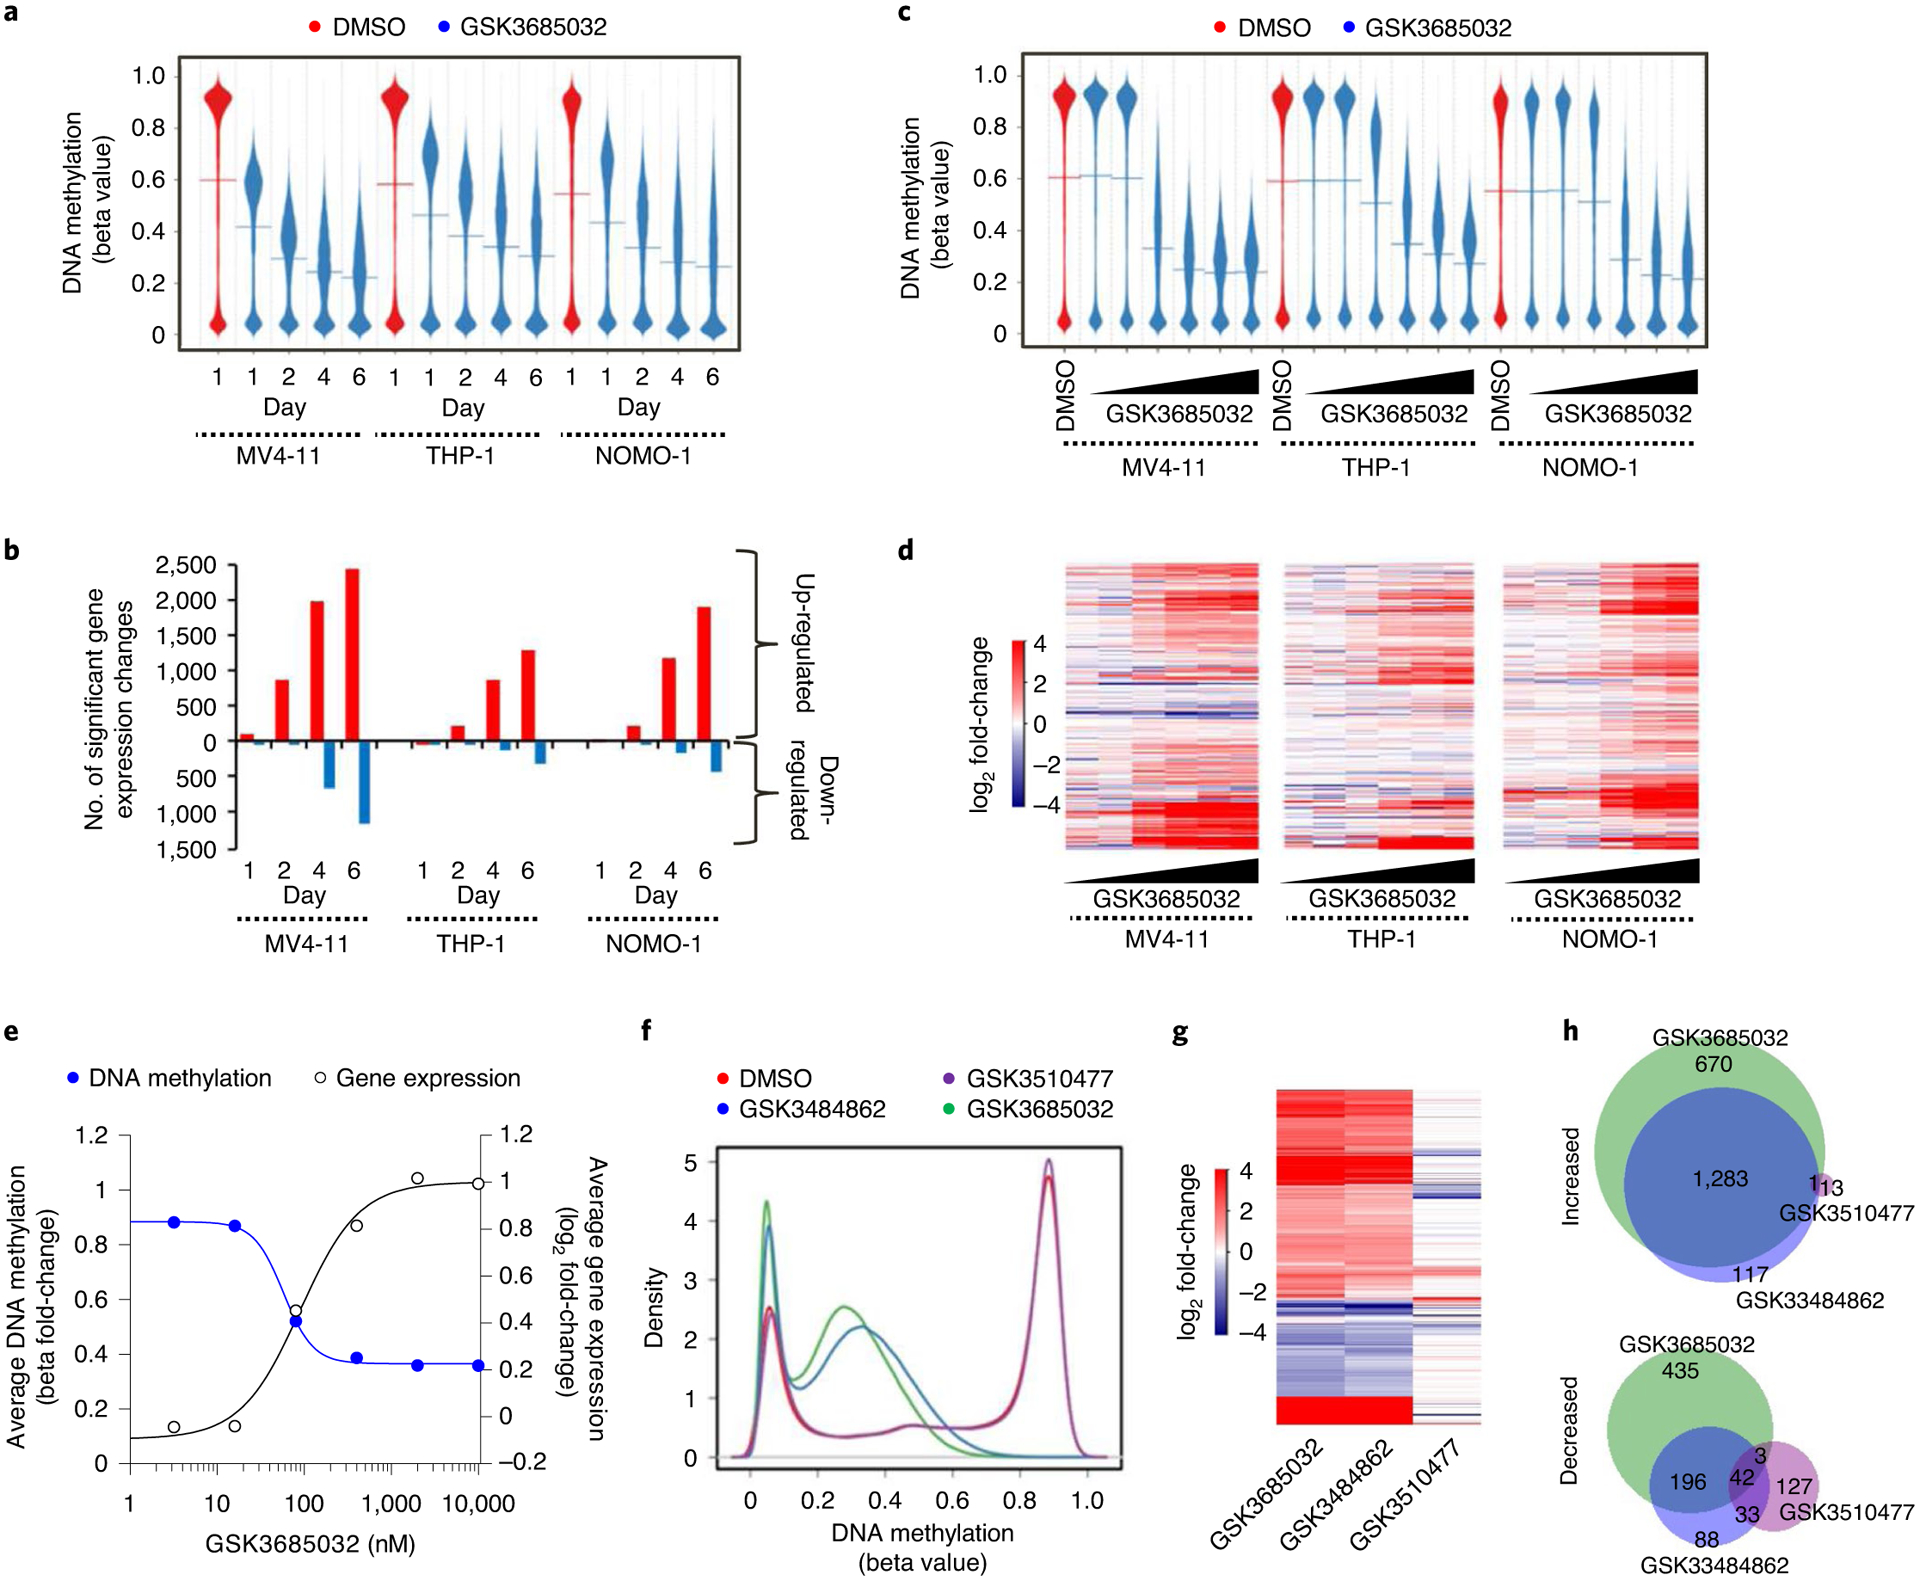
a,b, DNA methylation profile (a, Infinium Methylation EPIC, line represents the mean, n = 866,091 probes) and the number of gene expression changes (b, RNA-seq) for GSK3685032 (400 nM)-treated cells over time. c,d, DNA methylation profile (c, Infinium Methylation EPIC, line represents the mean, n = 866,091 probes) and differential gene expression log2 fold-change heatmap (d, RNA-seq, n = 13,969 genes) for GSK3685032 (3.2–10,000 nM)-treated cells at day 4. e, Fold-change in promoter methylation and gene expression following treatment in MV4–11 cells (day 4) for genes (n = 4,424) with beta values in vehicle samples ≥0.8 ± 200 bp from transcription start site (TSS). f–h, DNA methylation profile (f, Infinium Methylation EPIC, n = 866,091 probes), heatmap of significant gene expression changes (g, RNA-seq, false discovery rate (FDR) < 0.05, |log2 fold change| > 1, n = 2,970 genes) and Venn diagram (h) showing the overlap of up- and down-regulated genes in MV4–11 cells treated with dimethylsulfoxide, GSK3510477 (10,000 nM), GSK3484862 (1,000 nM) or GSK3685032 (400 nM) for 4 d.