
Fig. 7 |. Comparison of nucleoside versus non-nucleoside DNMT inhibitors.
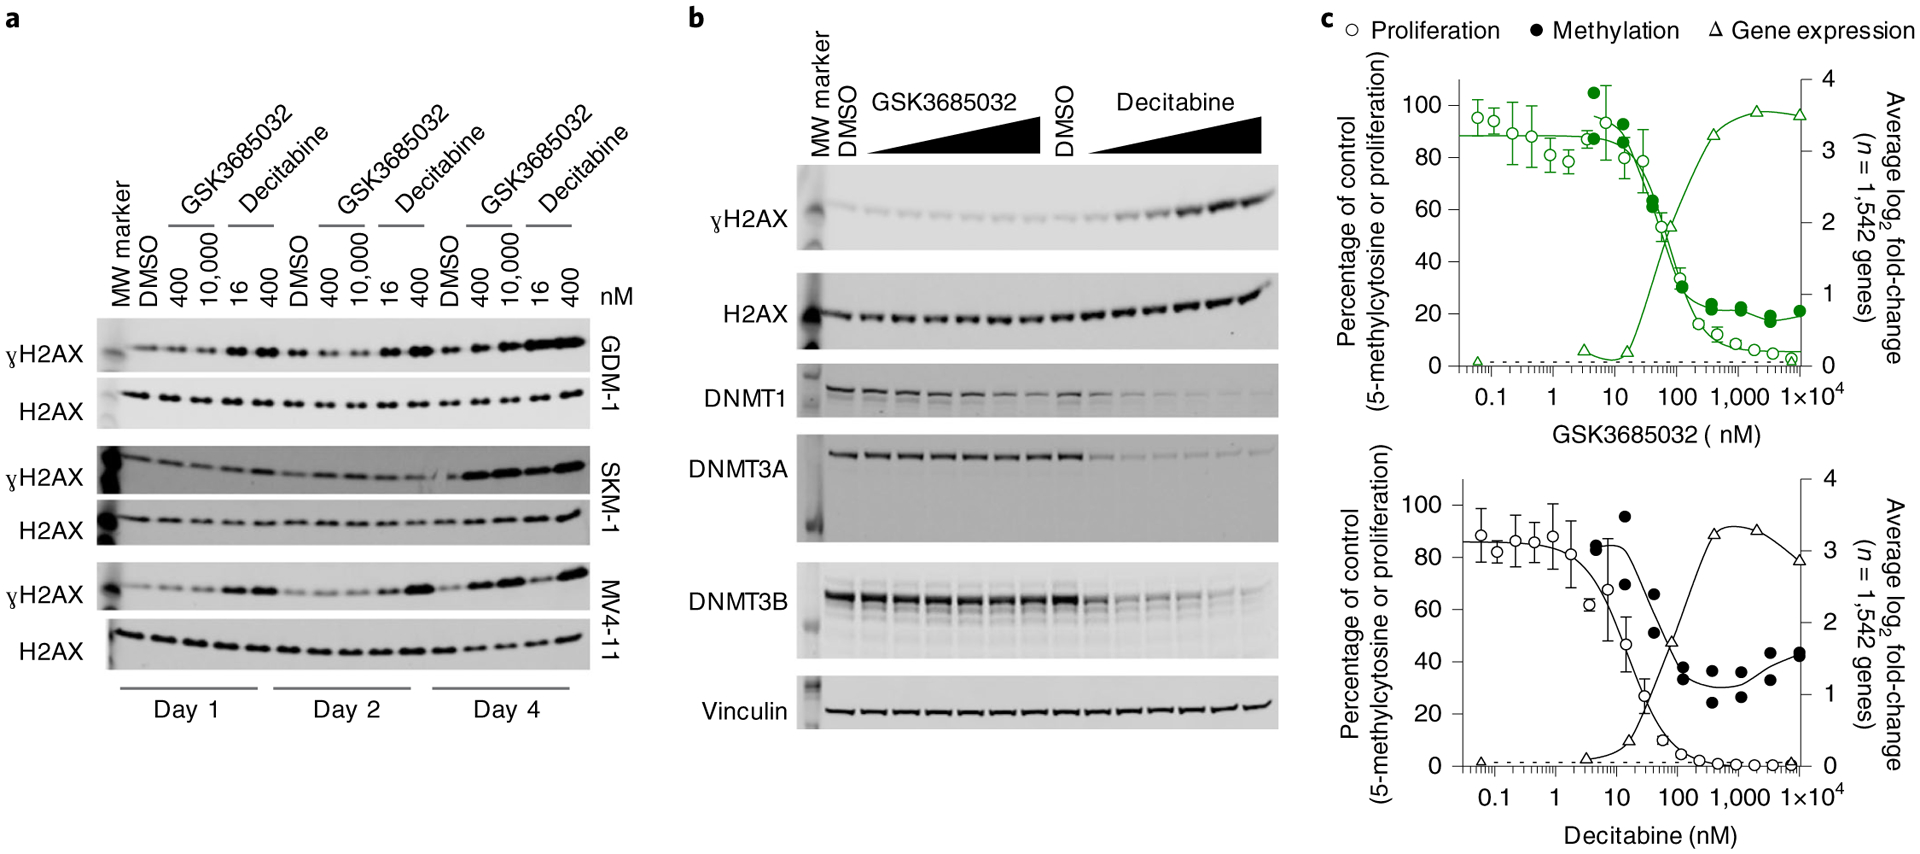
a,b, Western blots were cropped to highlight protein(s) of interest. Images shown are from a single experiment, processed in parallel, and data are representative of two independent experiments. Uncropped images can be found in the source data. MW, molecular weight. a, Induction of ɣH2AX protein levels in MV4–11, GDM-1 or SKM-1 cells treated for 1, 2 or 4 d. Total H2AX is shown as a loading control. b, Changes in ɣH2AX, DNMT1, DNMT3A and DNMT3B protein levels in GDM-1 cells treated for 2 d with a titration of GSK3685032 or DAC (3.2–10,000 nM). Total H2AX and vinculin are shown as loading controls. c, Overlay showing proliferation (day 6, n = 4 biologically independent experiments; average ± s.d.), 5-methylcytosine (day 4, n = 2 biologically independent experiments) and significant gene expression (RNA-seq, FDR < 0.05, |log2 fold-change| > 1; day 4, average of n = 1,542 overlapping genes) changes in DAC- or GSK3685032-treated MV4–11 cells.