
Fig. 8 |. GSK3685032 reveals improved in vivo efficacy and tolerability in AML models compared with DAC.
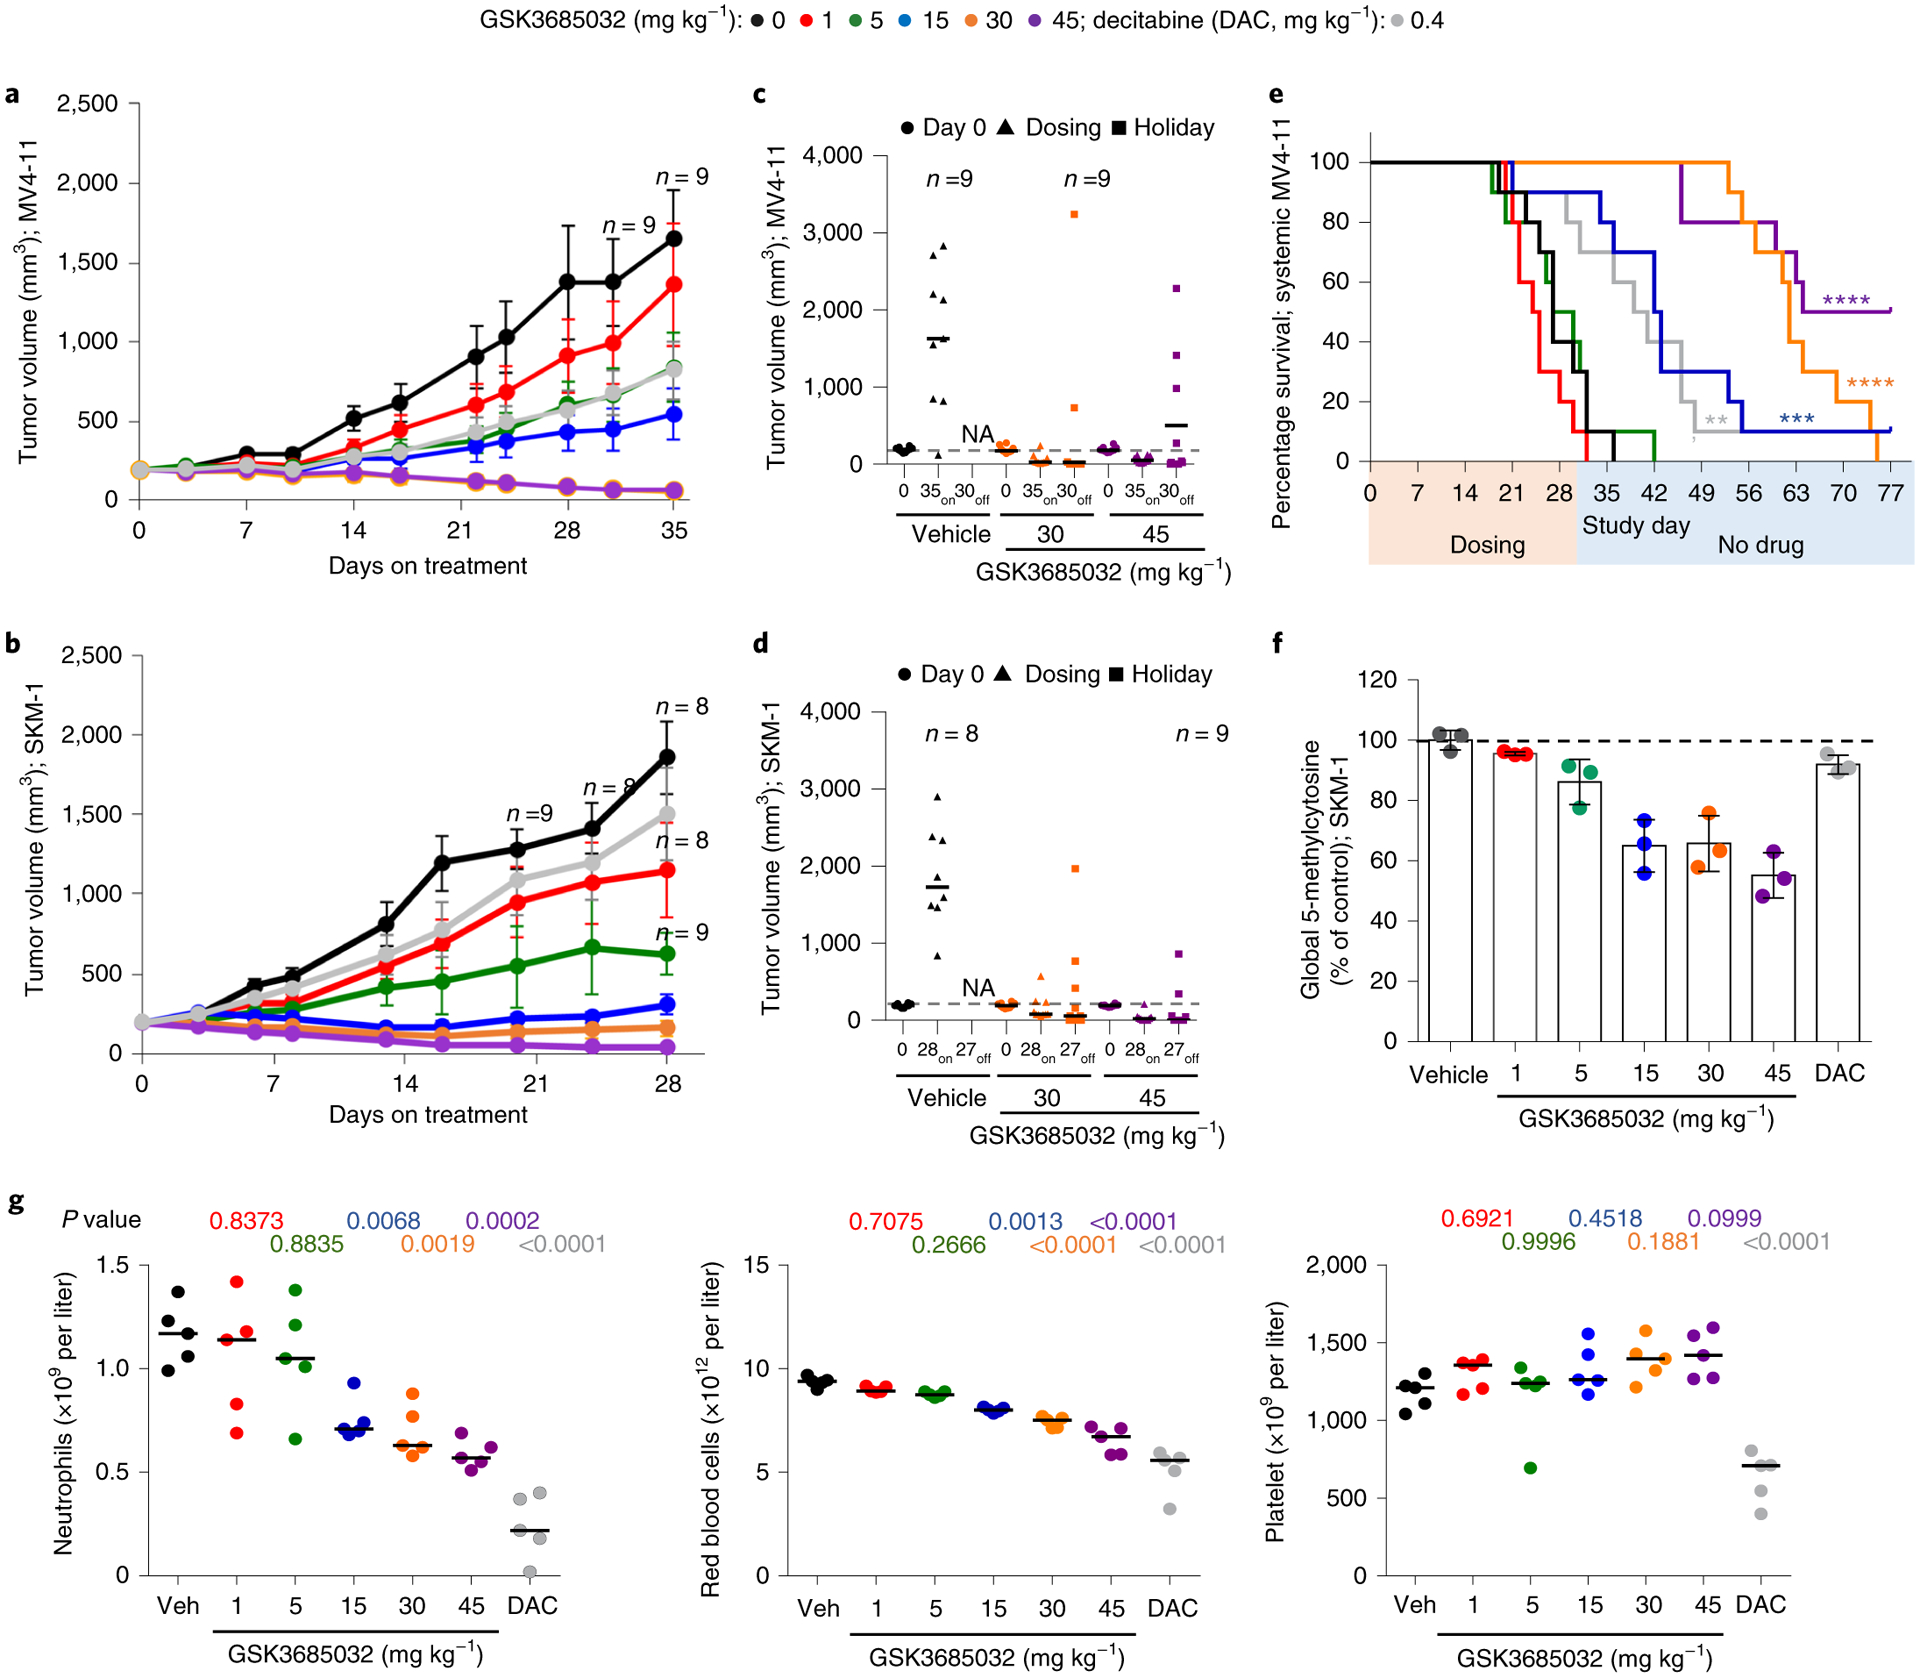
a,b, Tumor volume measurements (n = 10 animals per group at each data point unless marked; average ± s.e.m.) for a subcutaneous MV4–11 (a) or SKM-1 (b) xenograft model following treatment with GSK3685032 (subcutaneous, twice daily) or DAC (intraperitoneal, three times weekly). c,d, Tumor volume measurements at study start, at last dose, and at the end of a dosing holiday for individual animals in a subcutaneous MV4–11 (c) or SKM-1 (d) xenograft model. Solid line represents the median for each group (n = 10 animals per group unless marked). Dotted line represents the median tumor volume for vehicle at study start. No animals remained in the vehicle group at study end (NA). One animal (30 mg kg−1, MV4–11 (c) and 45 mg kg−1, SKM-1 (d)) was inadvertently taken off study at the last dose and did not undergo observation for recovery. e, Kaplan–Meier plot showing animal survival in a disseminated MV4–11 model (n = 10 animals per group) where dosing occurred during the first 30 d. Statistical significance* was calculated using the log-rank (Mantel–Cox) test yielding P values for GSK3685032 of 0.1377 (1 mg kg−1), 0.8080 (5 mg kg−1), 0.0003 (15 mg kg−1), <0.0001 (30 mg kg−1) and <0.0001 (45 mg kg−1), or 0.0034 for DAC. f, Pharmacodynamic changes, measured as global 5-methylcytosine, in SKM-1 tumors (8.5 d, n = 3 animals per group, average ± s.d.). Dotted line represents vehicle control levels of 5-methylcytosine. g, Neutrophil, red blood cell and platelet counts from day 28 of the SKM-1 xenograft study. Solid line represents the median for each group (n = 5 animals). Statistical significance, listed as adjusted P value to account for multiple comparisons, of treatment versus vehicle was calculated using one-way ANOVA, Dunnett’s multiple comparisons test. Veh, vehicle.