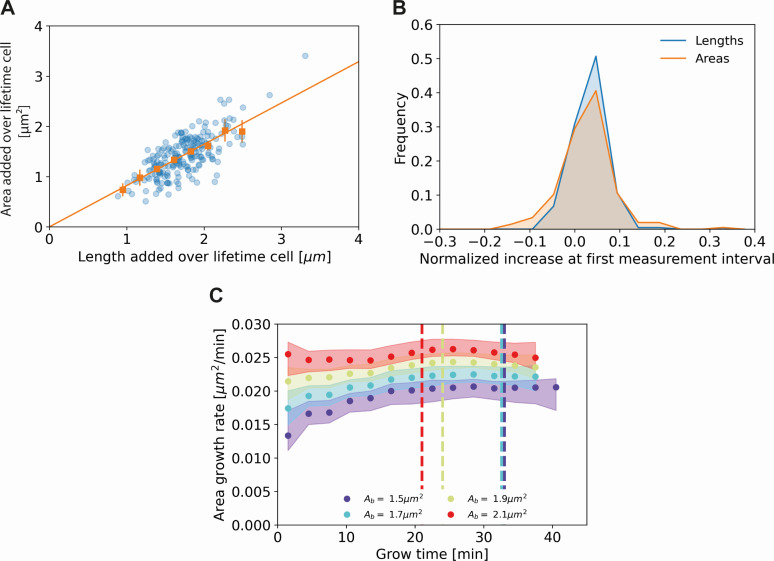
Appendix 2—figure 1. Comparing cell length and cell area measurements.
(A) Length added versus area added over the cell lifetime for all cells included in our analysis (blue dots), together with averaged values at 0.2 μm intervals (orange squares) and 95% confidence intervals (orange vertical lines). The results are consistent with a proportional relationship (orange line). (B) Histogram of the normalized increase at first measurement interval using cell lengths (blue) and areas (orange). For the cellular lengths, this quantity is defined as , whereas for the areas it is defined as , with the area at time and the birth area. The wider distribution for the areas suggests a higher measurement noise for this quantity. (C) Area growth rate for DivIVA-labeled cells using estimated cell areas. The trajectories are consistent with those obtained from cell lengths (Main Text Figure 5A).

