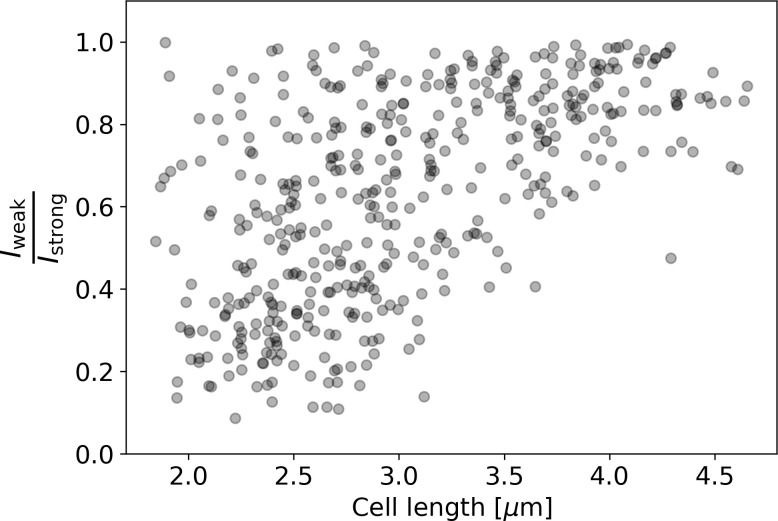
Appendix 2—figure 11. Ratio of intensities between the weaker and the stronger pole of each cell in the HADA staining experiment.
Polar intensities are calculated as described in Appendix 2—figure 8. Here, denotes the intensity of the cell pole with the weaker HADA intensity signal, and denotes the intensity of the pole with the stronger signal. For NETO-like growth (Hannebelle et al., 2020), a clustering of values around 0 (before new end take off) and 1 (after new end take off) would be expected, which is not observed here.

