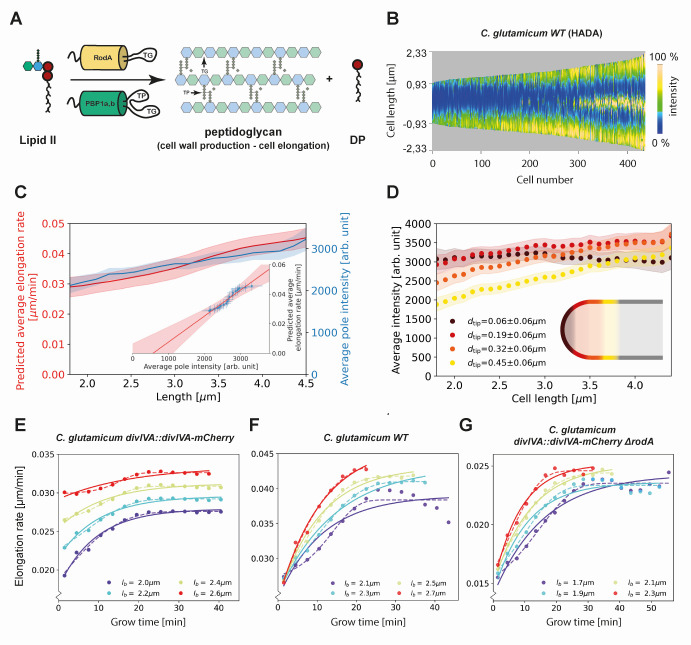
Figure 6. Modeling of average elongation rates using HADA staining results.
(A) Schematic depicting cell wall formation via Lipid-II and transgrlycosylases (TG's). The corresponding Michaelis-Menten equation describes the change of length over time as function of the Lipid-II concentration and the number of the TG sites . (B) Demograph of C. glutamicum cells stained with HADA. Cell are ordered by length, with the stronger signal oriented downwards. (C) Average elongation rate as a function of cell length (red), predicted from obtained average elongation rate curves (Appendix 8), together with the average HADA staining intensity at the cell pole after background correction (blue). The cell pole is defined here as the region within 0.77 µm (60 pixels) of the cell tip. The shaded regions indicate the 2XSEM bounds. For both curves, a moving average over cells within 0.7 µm of each x-coordinate is applied over the underlying data. Inset: predicted average elongation rate versus average HADA staining intensity (blue dots). A linear fit through the result (red line) is consistent with a proportional relationship. (D) Average HADA intensity as a function of cell length, shown for four regions close to the cell tip. A moving average over cells within 0.7 µm of each x-coordinate is applied over the underlying data. (E-G) Dots: average elongation rate curves as shown in Figure 5A. Solid lines: best fit of elongation model from Equation (2), which assumes constant transglycosylase recruitment. Dashed lines: best fit of elongation model from Equation (3), which assumes an exponential increase of transglycosylase recruitment.

